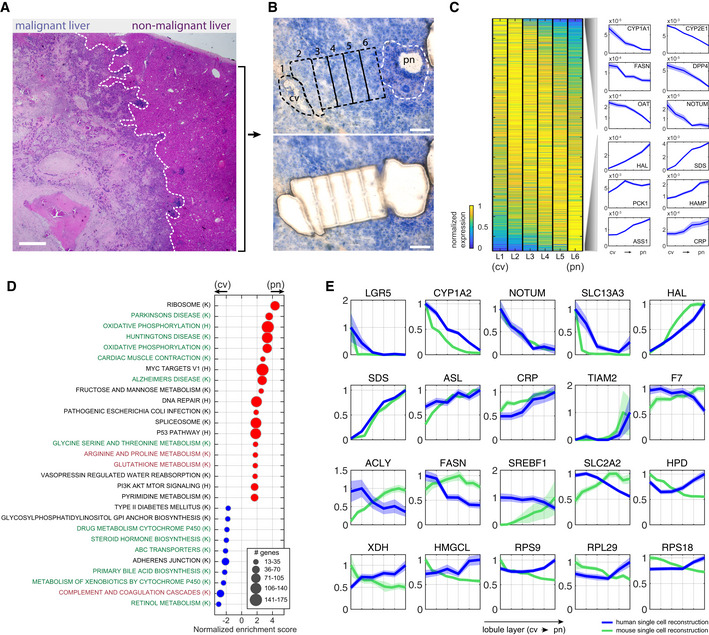
Figure 5. Spatial analysis of the malignant and non‐malignant human liver.

- H&E staining of malignant and non‐malignant sites from patient p4, separated by the white dashed line. Scale bar is 100 µm.
- Non‐malignant human liver lobule from patient p4 used for LCM stained with HistoGene Staining Solution (Materials and Methods). Top—sequential zones from the central vein (cv) to the portal node (pn) before microdissection. LCM captured zones marked by the black dashed line. White dashed line marks the boundaries of NPC (non‐parenchymal cells) located in the pn and not included in the analysis. Bottom—Tissue after microdissection. Scale bar is 100 µm.
- Zonation of human hepatocytes. Left—Max normalized expression over the reconstructed six lobule layers (L1–L6), sorted by center of mass from the central vein (cv) to the portal node (pn). Right—selected pericentrally (top), and periportally (bottom) zonated genes. Blue patches are standard errors of the mean.
- Gene set enrichment analysis of genes with maximal expression above 1e‐5 normalized UMI counts. Centrally (cv) enriched sets are marked with blue dots, and portally (pn) enriched sets are marked with red dots. Green fonts denote pathways that are concordantly zonated in mouse, black fonts denote pathways that are not zonated in mouse, and red fonts denote pathways that are inversely zonated in mouse. “K” denotes gene sets obtained from KEGG database, and “H” denotes gene sets obtained from Hallmarks database.
- Zonation profiles of selected genes from human (blue) and mouse (green). Each profile is normalized by the maximal expression across zones. Patches are standard errors of the mean.
Data information: Mouse data used in (D and E) were obtained from Halpern et al (2017).
