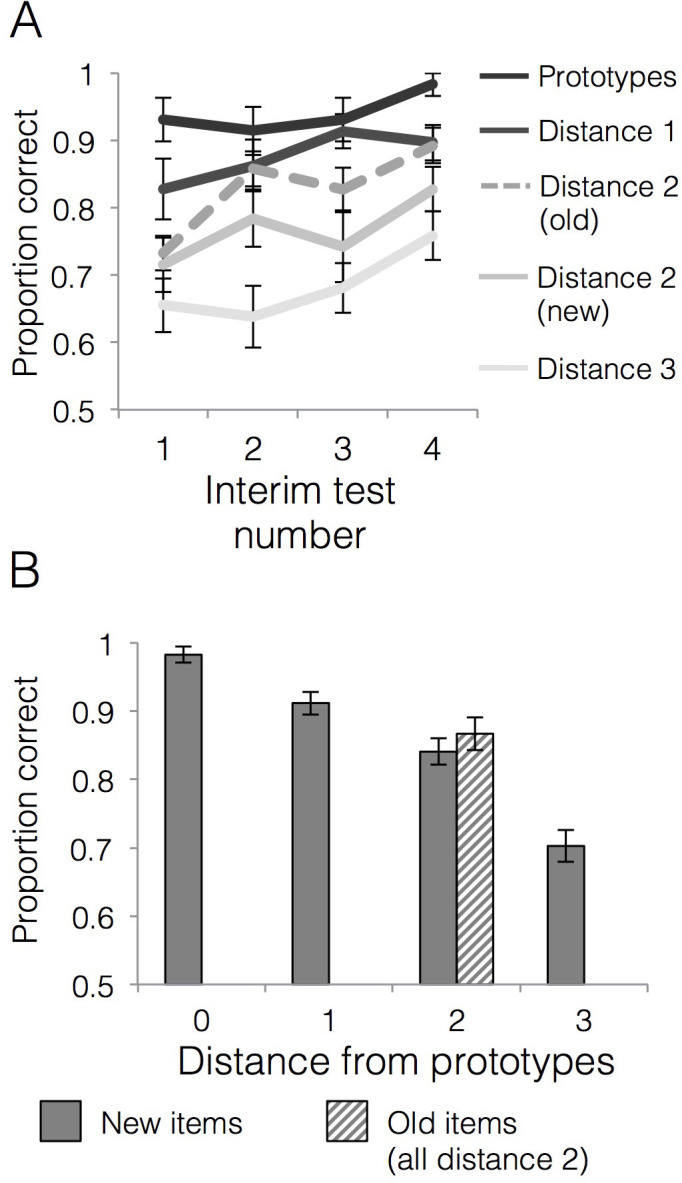
Figure 3. Behavioral accuracy for interim and final tests.

(A) Mean generalization accuracy across each of four interim tests completed during the learning phase. Source data can be found in Figure 3—source data 1. (B) Mean categorization accuracy in the final test. Source data can be found in Figure 3—source data 2. In both cases, accuracies are separated by distance from category prototypes (0–3) and old vs. new (applicable to distance two items only). Error bars represent the standard error of the mean.
