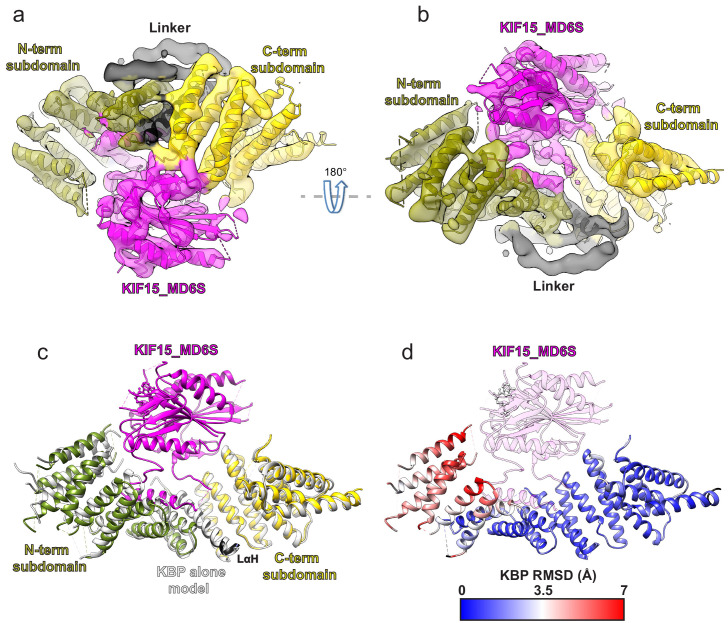
Figure 2. Kinesin-binding protein (KBP) conformationally adapts to bind KIF15’s motor domain via both subdomains.
(a) Model of the KBP–KIF15_MD6S complex (ribbon representation) displayed in experimental cryo-electron microscopy density. The N-terminal (olive) and C-terminal (gold) subdomains and the linker helix (black) are shown in KBP, while kinesin is coloured in magenta. Semi-transparent density is coloured regionally as per the fitted model and additional density for the linker loop is shown in semi-transparent black. (b) The same as panel a, but rotated 180° around the axis indicated. (c) The KBP-alone model (light grey ribbons) was superimposed on the KBP–KIF15_MD6S model (opaque ribbons) using Chimera’s matchmaker (Pettersen et al., 2004). Colouring and view as in panel b. (d) RMSD in Å for KBP comparing KBP–KIF15_MD6S and superimposed KBP-alone models as in panel c, shown on KBP from the KBP–KIF15_MD6S model. Parts of the KBP model coloured black are disordered/missing in the KBP alone model. The KIF15_MD6S is shown in transparent magenta.


