. 2020 Dec 7;9:e61405. doi: 10.7554/eLife.61405

Figure 4. A synthetic lethal screen identifies common sensitivity of cohesin-deficient cells to WNT activation and BET inhibition.

(A) Schematic overview of the synthetic lethal screen. (B,C,D) Overview of the differential area over the curve (AOC) activity of all compounds tested in cohesin-deficient cell lines relative to parental MCF10A cells in the primary screen. A threshold of differential AOC ≥ 0.15 (red dashed lines) was used to filter candidate compounds of interest. (E) Venn diagram showing the number of common and unique compounds that inhibited RAD21+/-, SMC3+/-, and STAG2-/- in the primary screen. (F,G) Dose-response curves of I-BET-762 and LY2090314. Source data is available for B–E in Figure 4—source data 1.

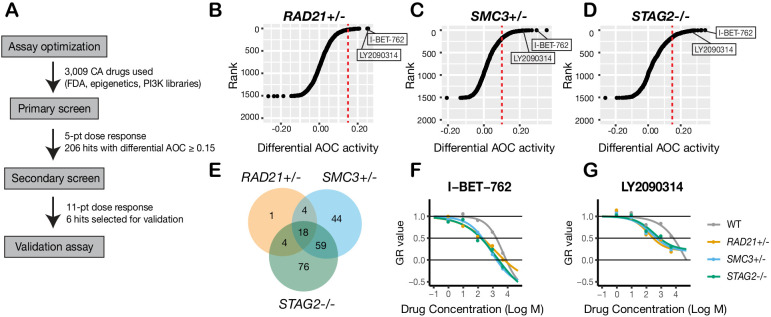
Figure 4—source data 1. Raw cell counts for SL screen compound treatments.
elife-61405-fig4-data1.xlsx (336.6KB, xlsx)
Figure 4—source data 2. Table and AOC measurements of all hit compounds from the screen.

Figure 4.

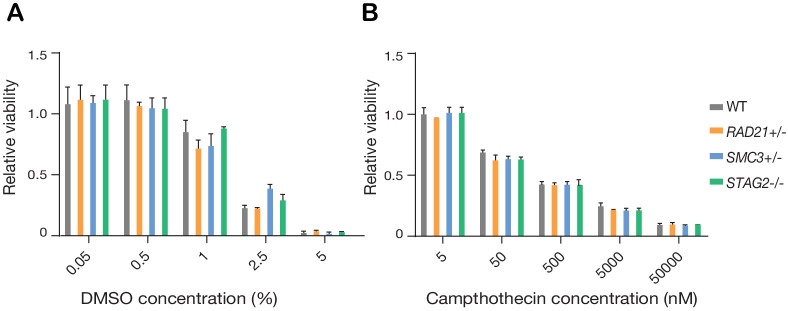
Figure 4—figure supplement 1. Synthetic lethal screen controls.

Figure 4—figure supplement 1.

(A) DMSO (negative control) and (B) Camptothecin (positive control) titrations were used to establish a cytotoxicity range in MCF10A cells and cohesin-deleted derivatives. n = 2 independent experiments, mean ±s.d.
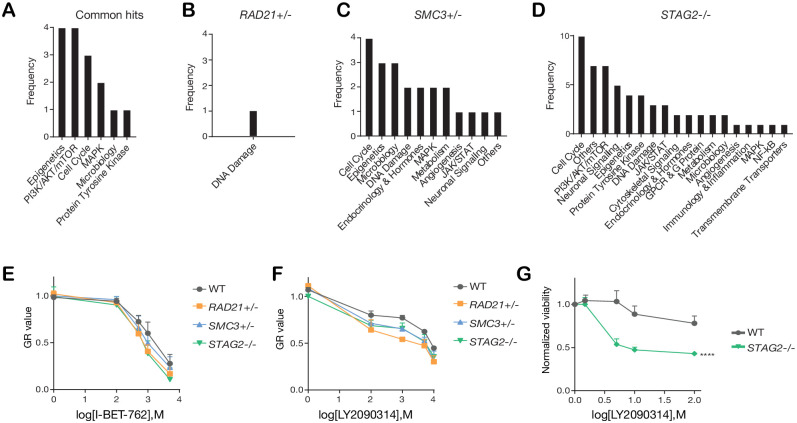
Figure 4—figure supplement 2. Categories of compounds that differentially inhibit cohesin-deficient cells.

Figure 4—figure supplement 2.

(A) Common and (B,C,D) unique categories of compounds identified in the primary screen. See Figure 4—source data 1 for details. (E,F) Dose-response curves were generated for validation of I-BET-762 and LY2090314 in MCF10A cells. (G) Dose-response curve of LY2090314 in the K562 STAG2R614* mutant cell line. Two-way ANOVA: ****p≤0.0001 Source data is available for Figure 4A–D in Figure 4—source data 2.