. 2020 Dec 9;9:e64007. doi: 10.7554/eLife.64007

Figure 3. The core clock target of PRD-2 is the casein kinase I transcript.

Control and Δprd-2 cultures were grown in the light at 25°C in Bird medium for 48 hr prior to RNA isolation. Expression levels for core clock genes were measured by RNA-sequencing (N = 3 biological replicates per strain), and log2-transformed FPKM values are shown. Asterisks indicate p<0.05 (*) or p<5 × 10−5 (***) by Student’s t-test compared to control levels. The ck-1a transcript is >1.5× less abundant in Δprd-2 (A). ck-1a mRNA degradation kinetics were examined by Northern blot in a time course after treatment with thiolutin (THL) at approximately CT1 (N = 2 biological replicates). RNA levels were quantified using ImageJ, natural log transformed, fit with a linear model (glm in R, Gaussian family defaults), and half-life was calculated assuming first order decay kinetics (ln(2)/slope). Shaded areas around the linear fit represent 95% confidence intervals on the slope. The ck-1a transcript is 3× less stable in Δprd-2 (B). The PUF4 (NCU16560) RNA-binding protein pulls down known target transcripts cbp3 (NCU00057) and mrp-1 (NCU07386) by RT-qPCR (N = 3 biological replicates). PRD-2 CLIP samples were processed in parallel with PUF4 positive controls, and PRD-2 binds the ck-1a transcript in vivo (C).

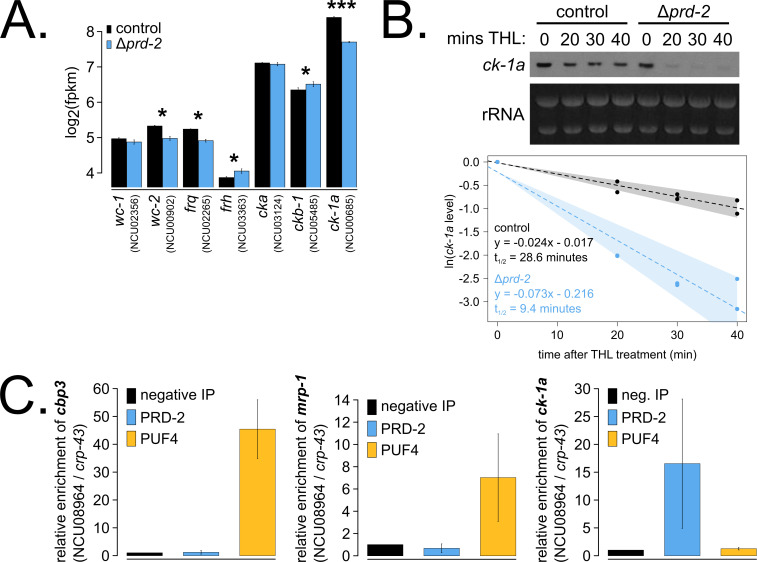
Figure 3.

Figure 3—figure supplement 1. Hundreds of genes have altered expression levels in the Δprd-2 mutant but a common pathway or sequence motif was not detected.

Figure 3—figure supplement 1.

RNA-seq data were first filtered for low expression. Out of 9730 annotated N. crassa genes, 8622 were expressed in four of six samples (>0 FPKM units in triplicate control and Δprd-2). FPKM units for 8622 expressed genes were log2-transformed, averaged, subtracted from control, and Z-scores computed. In all, 129 genes (gold) were upregulated in Δprd-2 (Z-score < −2) and 292 genes (blue) were downregulated in Δprd-2 (Z-score >2). Hypothesizing that PRD-2 is an RNA-binding protein that stabilizes its target transcripts (Figure 3B), we searched for enriched sequence motifs in the untranslated regions of the 292 downregulated genes using Weeder2 (212 annotated 5’-UTRs and 226 annotated 3’-UTRs searched). Zero motifs scored better than 1.5 from Weeder2 output compared to background Neurospora nucleotide frequencies (data not shown). Up- and downregulated gene categories were then run through FunCat to determine functionally enriched categories of genes in the putative PRD-2 regulon. Of the 292 downregulated genes, 128 were input to FunCat, and the top scoring functional categories indicated that carbohydrate and secondary metabolism were decreased in Δprd-2. Out of 128 upregulated genes, 80 were also input to FunCat, and other metabolism categories were identified, which could indicate altered central carbon metabolism in the Δprd-2 mutant, correlating with its slow growth phenotype (Figure 1C).
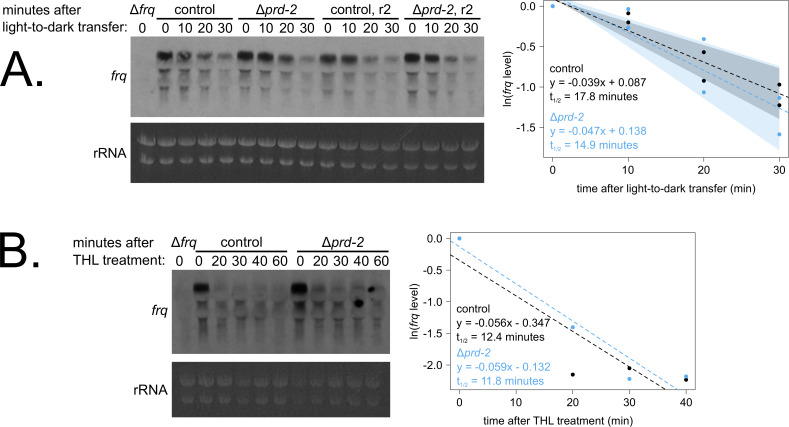
Figure 3—figure supplement 2. Loss of prd-2 has little effect on stability of the frq transcript.

Figure 3—figure supplement 2.

frq mRNA degradation kinetics were examined by northern blot in a time course after light-to-dark transfer (N = 2 biological replicates). RNA levels were quantified using ImageJ, natural log transformed, fit with a linear model (glm in R, Gaussian family defaults), and half-life was calculated assuming first order decay kinetics (ln(2)/slope). Shaded areas around the linear fit represent 95% confidence intervals on the slope. The frq half-life is approximately 3 min shorter in Δprd-2 but is not statistically different from the control (A). Using the same total RNA samples as shown in Figure 3B, frq degradation was examined by northern blot in a time course after treatment with thiolutin (THL) at approximately CT1 (N = 1 biological replicate). The stability of the frq transcript is not significantly altered in Δprd-2 after THL treatment (B) or light-to-dark transfer (A).