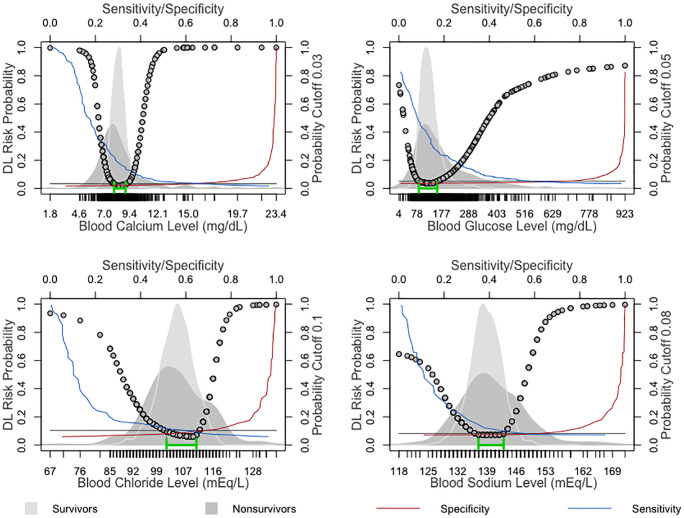
Fig 6. Univariate analysis depicting the nonlinear association of calcium, glucose, chloride and sodium values with the DL-derived probability of death within 8 hours based on surviving and nonsurviving ICU patients.
The background of each plot represents the density of estimates of the relevant variable among survivors and nonsurvivors. The green line segment indicates the optimal DL-derived range of probability cutoff points below the intersection of the sensitivity and specificity curves, along with the corresponding laboratory values.

