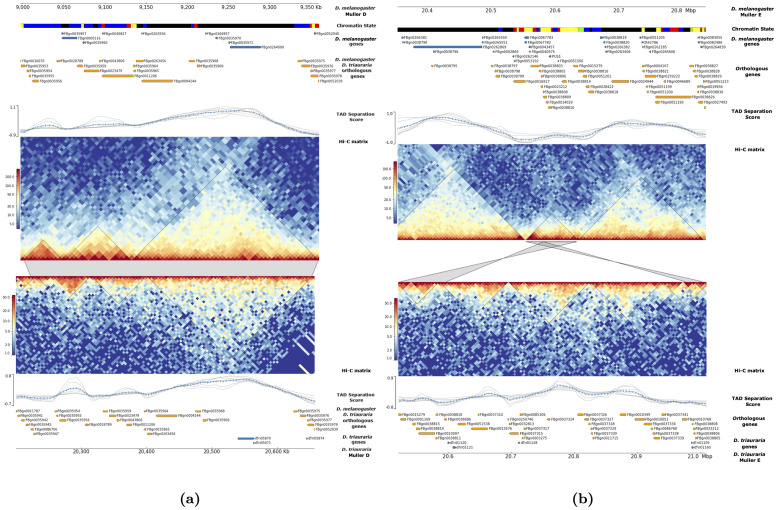
Fig 3. Visualization of orthologous and non-orthologous TADs.
A) Three orthologous, conserved TADs on Muller D between D. melanogaster (upper heatmap) and D. triauraria (lower heatmap). B) Non-orthologous, split TAD on Muller E between D. melanogaster (upper heatmap) and D. triauraria (lower heatmap). The black triangles on the contact matrices show the locations of TADs. The chromatin state annotations are based on Filion et. al. [53]. The chromatin classifications are as follows: BLACK: inactive, BLUE: Polycomb-repressed heterochromatin, GREEN: constitutive heterochromatin, RED: dynamic active, YELLOW: constitutive active. Orthologous genes are labeled by their FlyBase IDs and Hi-C matrices were generated by HiCExplorer. The grey blocks connecting matrices indicate syntenic regions. In B) gene tracks show that genes such as FBgb0038805, FBgn0038806, and FBgn0038814 are split between different TADs in D. triauraria and are in the reverse orientation compared to D. melanogaster.

