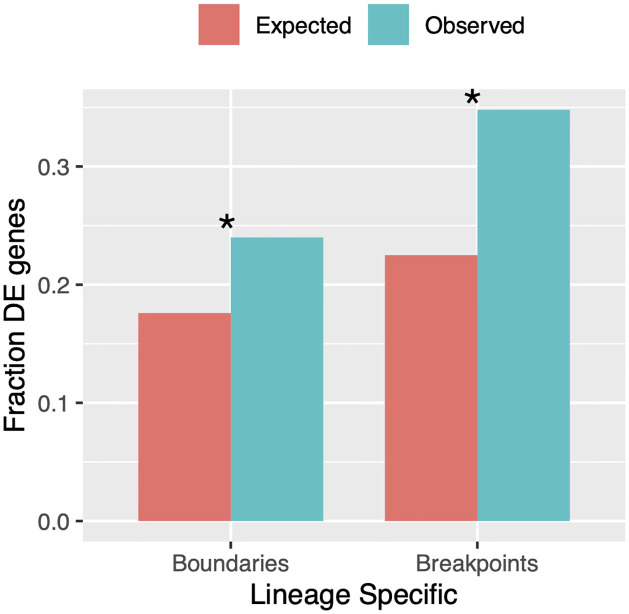
Fig 5. Differentially-expressed genes are enriched near locations where TADs are disrupted.
We calculated the fraction of differentially-expressed genes (DE) that lie within 10 kb of locations where TADs have been disrupted via chromosomal rearrangements or lineage-specific TAD boundaries. In both cases, we found significantly more differentially-expressed genes than expected by chance: Lineage-specific boundaries: observed: 24.0% [231], expected: 17.6% [170], hypergeometric p = 7.9e–8. Rearrangement breakpoints: observed: 34.8% [335], expected 22.5% [217], hypergeometric p = 2.6e–23.

