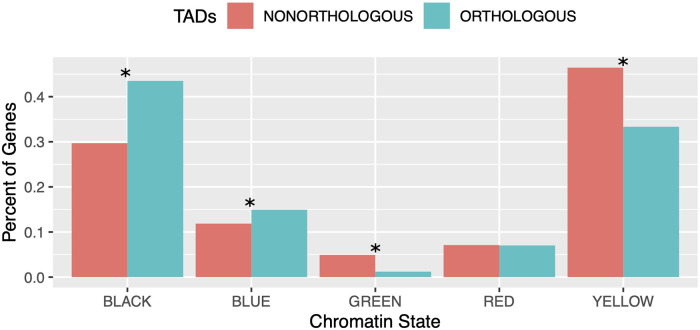
Fig 7. Orthologous TADs are enriched for transcriptionally silent and Polycomb-repressed genes.
The bar plot shows the percent of genes in each chromatin state (defined by [53]) in orthologous versus non-orthologous TADs. Orthologous TADs are significantly enriched for the BLACK (inactive) and BLUE (Polycomb-repressed) chromatin states and significantly depleted of the GREEN and YELLOW chromatin states. Asterices * indicate significant differences as calculated by Fisher’s Exact Test (p-values: BLACK = 1.225e–25; BLUE = 4.322e–4; GREEN = 1.552e–15; YELLOW = 8.375e–23; RED = 0.398).

