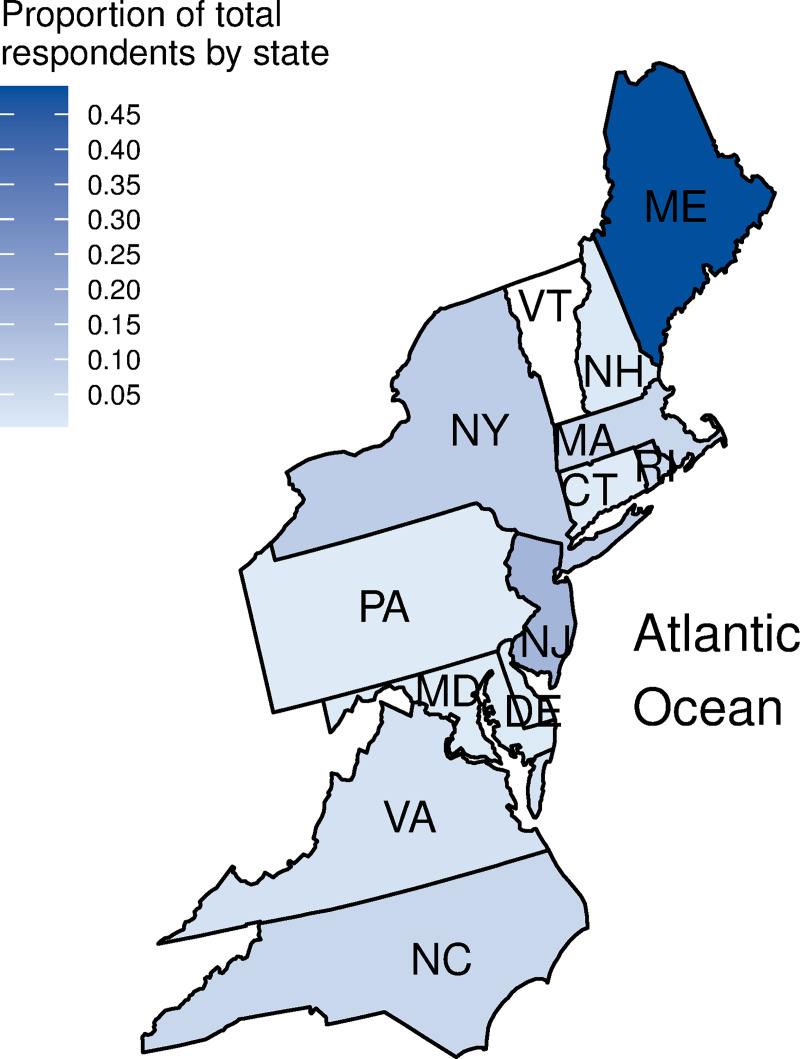
Fig 1. Proportion of total respondents by state.
The map shows the Northeast U.S. states (Maine through North Carolina) with percentage of survey responses represented by the blue shading. Responses also included one vessel owner who lived in Florida but owned a boat fishing in the Northeast (not included in the figure).

