
Fig. 2. Schematic of hippocampal dissection used for molecular studies.
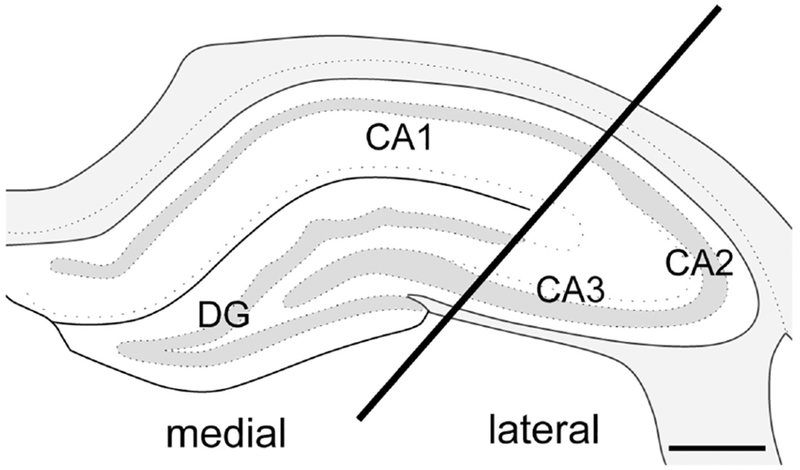
For the molecular studies, coronal dorsal hippocampal samples (~4 mm thick) were isolated and the block was separated into a medial sample primarily containing the CA1 and dentate gyrus and a lateral sample primarily containing the CA2 and CA3. Bar = 0.5 mm. Adapted from (Swanson, 1992).