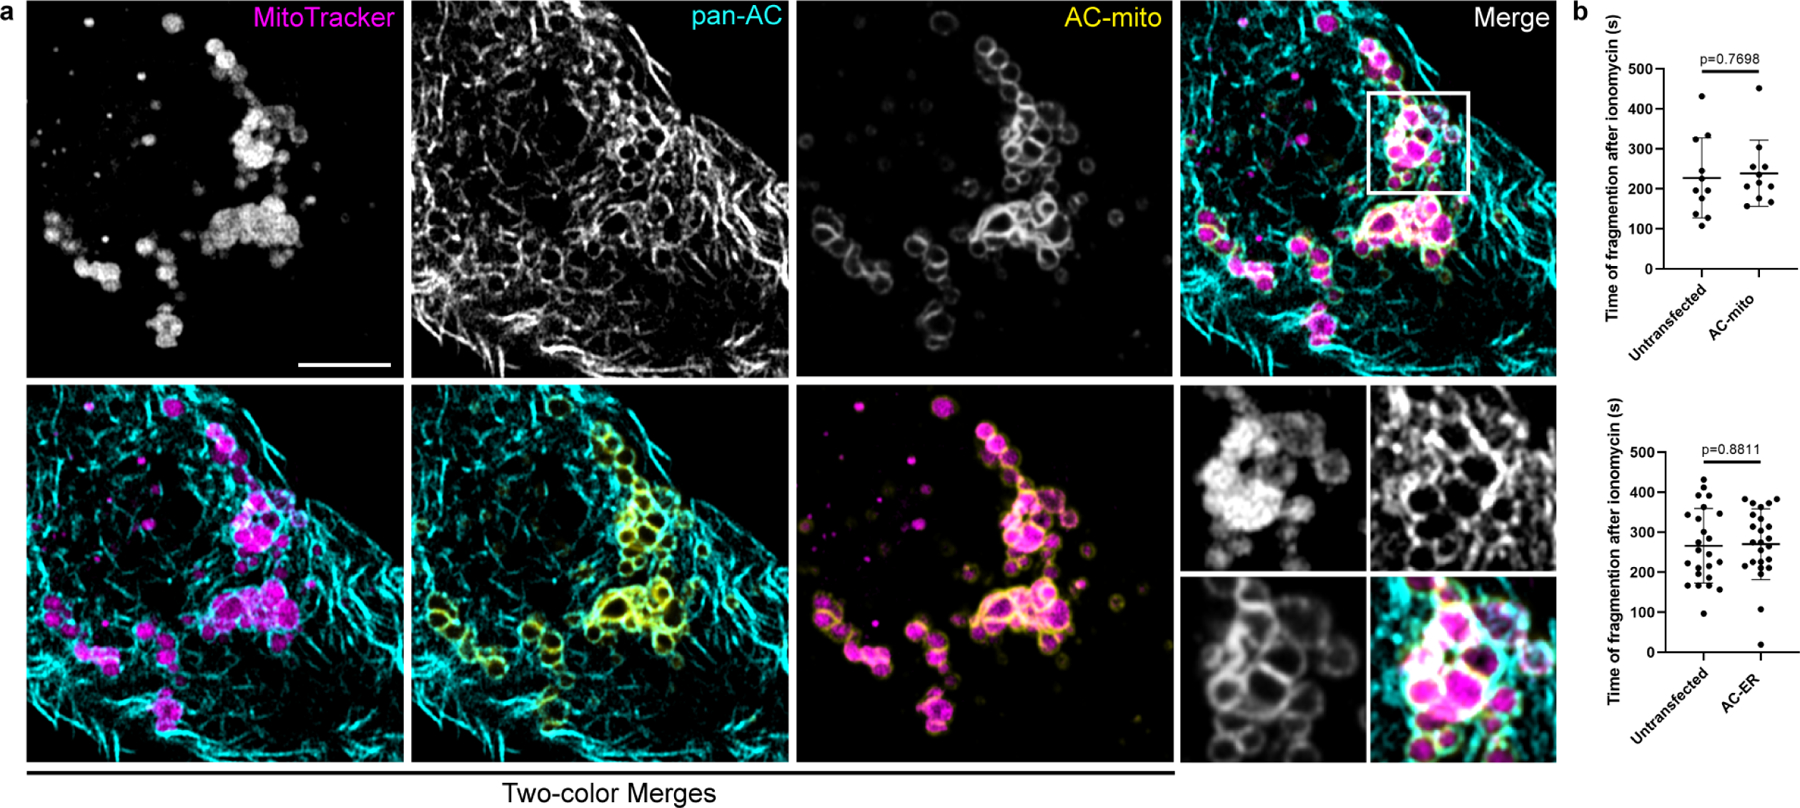
Extended Data Figure 8: Impact of ionomycin treatment on cells expressing AC probes.

A) HeLa cells stained with MitoTracker and expressing AC-mito and pan-AC (cytoplasmic AC-tagRFP) were treated with 10 µM ionomycin for 10 minutes. Fragmented mitochondria surrounded by both pan-AC and AC-mito can be visualized. Scale bar: 5 µm. These results were reproducible across 5 independent experiments. B) HeLa cells expressing AC-mito or AC-ER and counterstained with MitoTracker were treated with 10 µM ionomycin and imaged for 10 minutes. The time after ionomycin addition when mitochondrial fragmentation became evident was recorded for each cell. Cells from the same field displaying no AC-mito or AC-ER signal were considered untransfected. AC-mito: n= 11 cells, AC-ER: n = 24 cells. P-values determined by two-tailed Welch’s t-test
