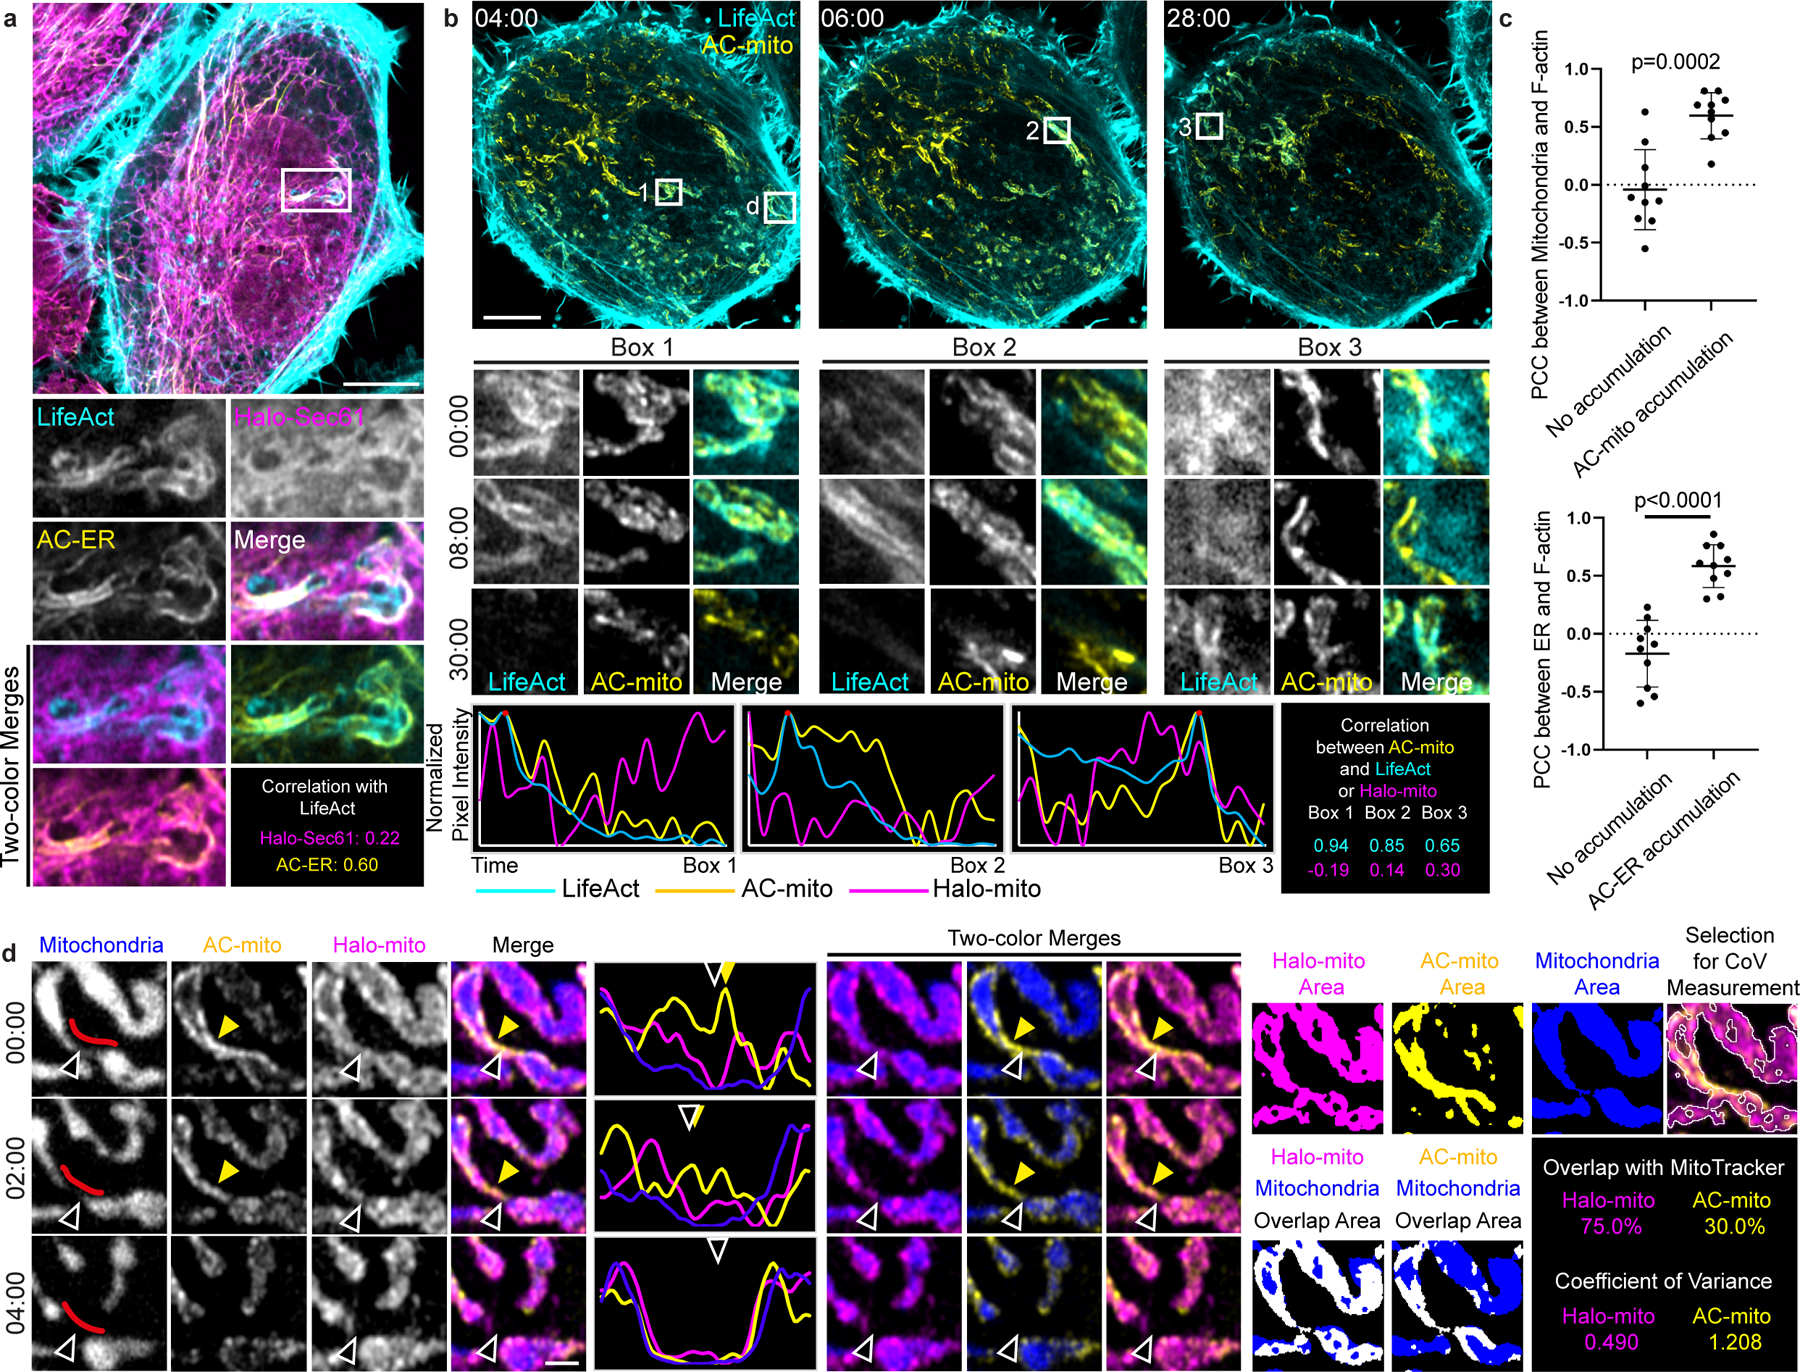
Figure 2: AC-mito and AC-ER dynamically label mito- and ER-associated actin.

A) AC-ER co-accumulates with actin. HeLa cell co-expressing LifeAct, AC-ER, and Halo-ER control probe is pictured with an area of actin and AC-ER co-accumulation shown in the high magnification images. Pearson’s correlation coefficient is displayed for LifeAct:Halo-ER and LifeAct:AC-ER in the boxed region. Scale bar: 5 µm. These results were reproducible across 12 independent experiments. B) AC-mito co-accumulates with actin. An actin wave cycling around the cell was imaged in HeLa cells co-expressing LifeAct, AC-mito, Halo-mito control, BFP-mito. Only LifeAct and AC-mito are shown for simplicity. Boxes 1–3 mark regions of LifeAct accumulation at different timepoints. Box “d” marks the area shown at higher magnification in panel D. Scale bar: 5 µm. Graphs show the change in LifeAct, AC-mito, and Halo-mito control pixel intensity in the boxed regions over time. The correlation between AC-mito:LifeAct and AC-mito:Halo-mito pixel intensity over time was calculated for each boxed region and results are displayed in the lower right. These results were reproducible across 4 independent experiments. C) Areas of AC probe accumulation mark sites of increased actin co-localization with mitochondria or the ER. Cells were either co-transfected with AC-mito and LifeAct and stained with MitoTracker (top graph) or co-transfected with AC-ER, LifeAct, and the mCherry-ER control probe (bottom graph). Pearson’s correlation coefficient was calculated between mitochondria:LifeAct (top graph) or ER:LifeAct (bottom graph) in regions showing AC probe accumulation. N = 10 cells per condition. P-values determined by two-tailed Welch’s t-test. D) AC-mito accumulates at sites of mitochondrial fission. A higher magnification of Box “d” from panel B shows mitochondria (BFP-mito), the Halo-mito control probe, and AC-mito signal during a mitochondrial fission event. The mitochondrial region used to generate the line scan is marked by red lines in the first column. Hollow arrows mark the mitochondrial fission site. Yellow arrows mark regions of AC-mito accumulation. Example images of the areas used to determine the degree of mitochondria overlap and coefficient of variance for Halo/AC-mito and the resulting values are shown on the right. Scale bar: 1 µm. These results were reproducible across 9 independent experiments.
