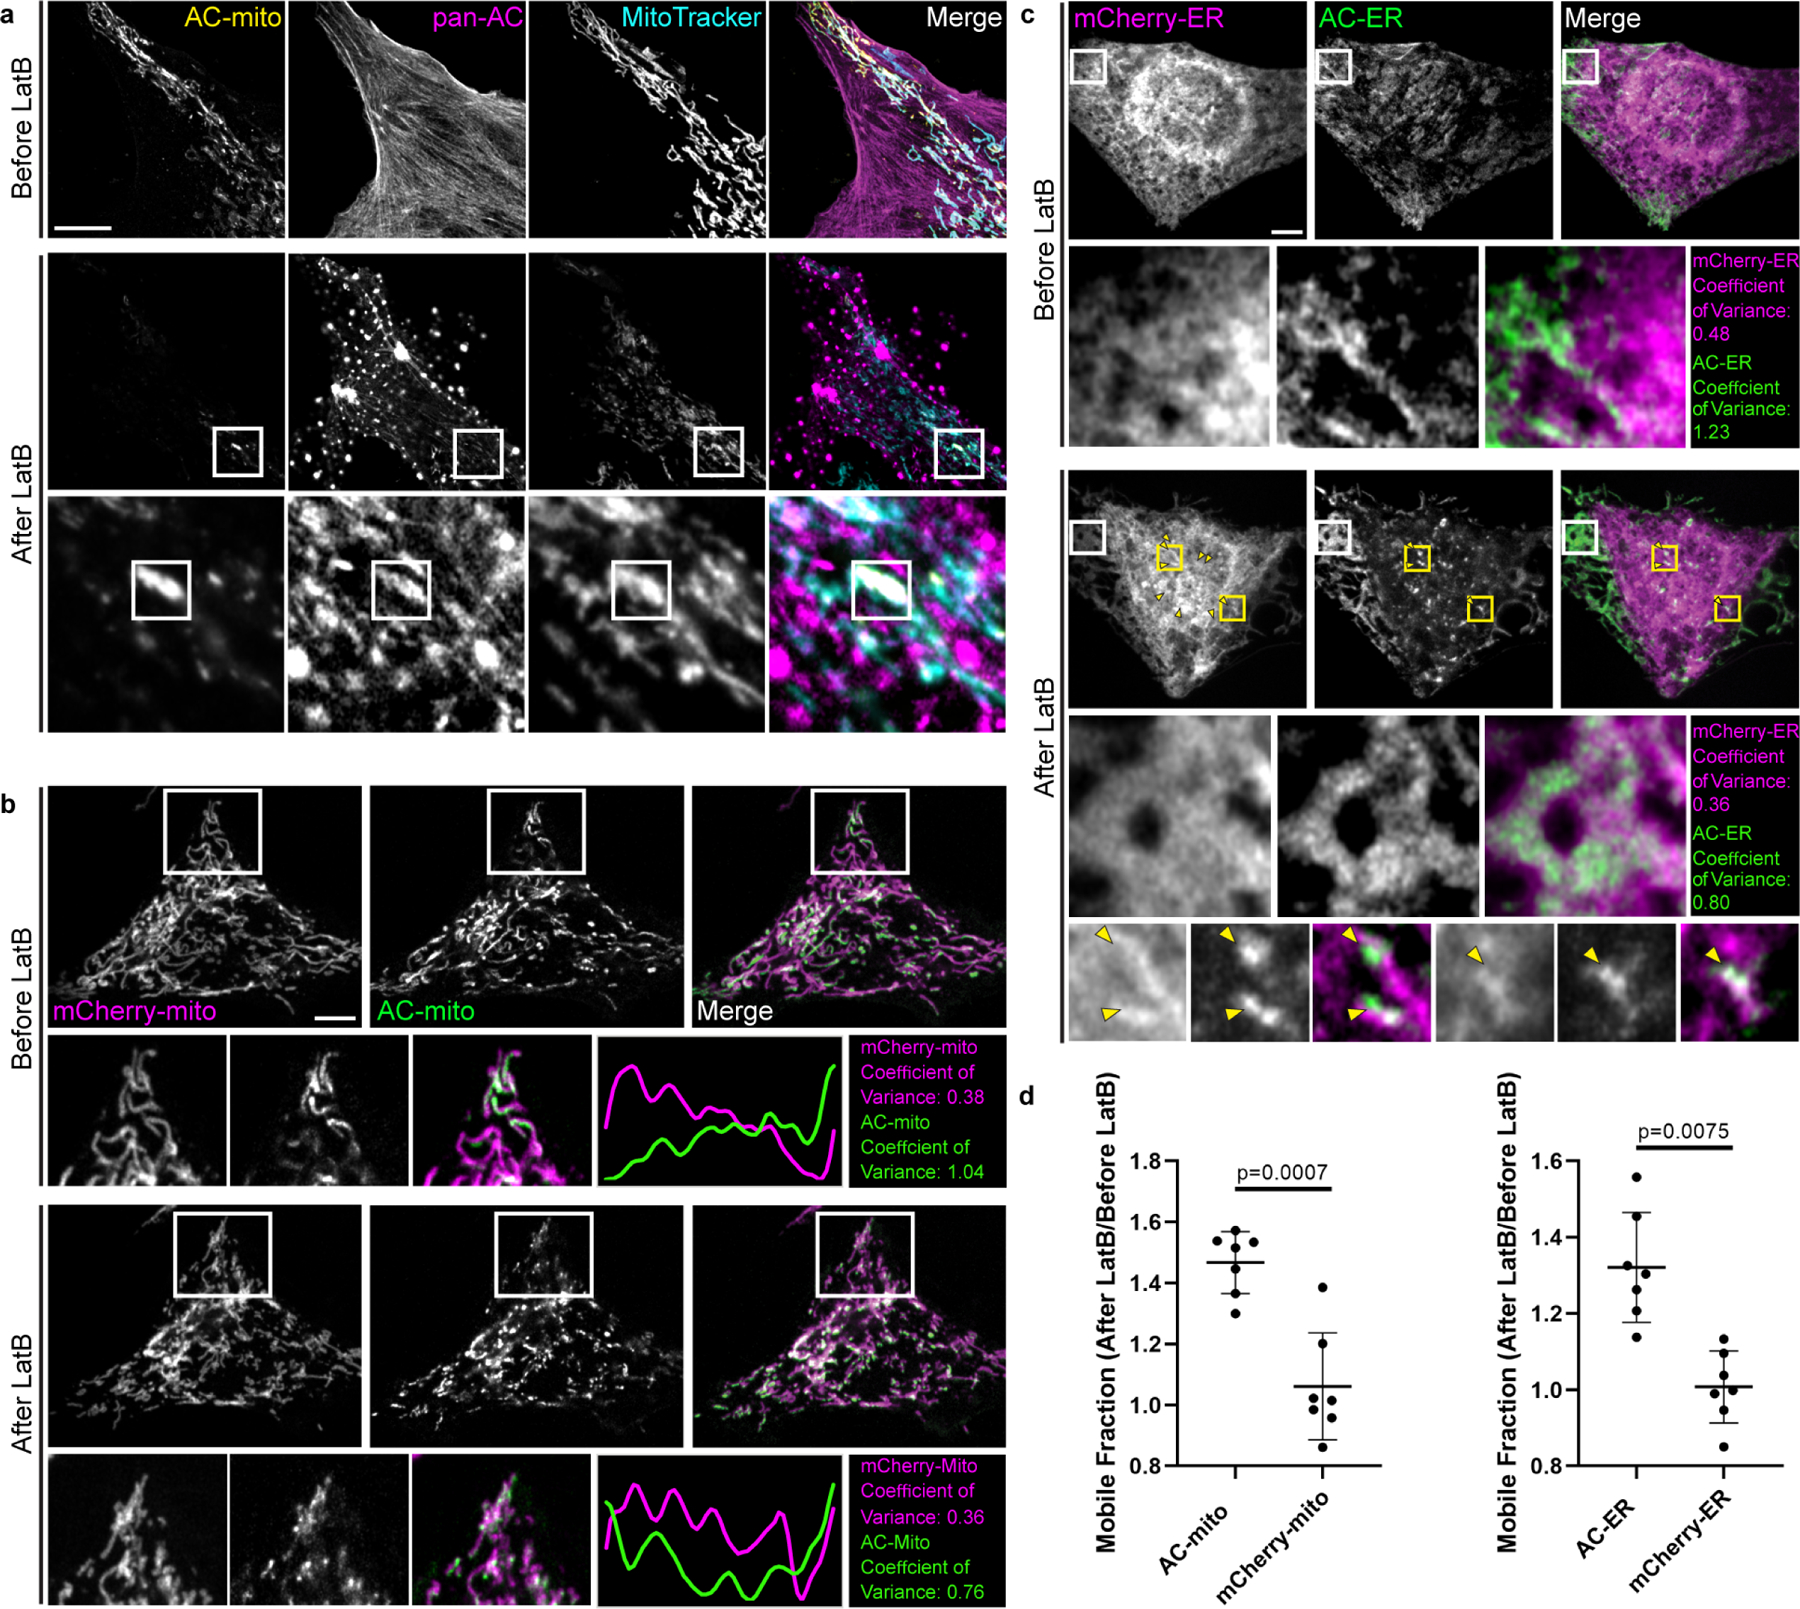
Extended Data Figure 6: Actin depolymerization destroys AC-mito and AC-ER accumulation.

A) U2OS cells stained with MitoTracker and expressing AC-mito and pan-AC (cytoplasmic AC-tagRFP) were imaged before and after treatment with 2 µM Latrunculin B (LatB) for 30 minutes. After LatB treatment, AC-mito displayed significantly reduced accumulation at specific regions on mitochondria. This loss of accumulation was observed in all cells imaged after treatment with LatB or Cytochalasin D (n = 6 cells). The magnified images in the bottom row show an example of LatB treatment causing actin aggregates which colocalize with AC-mito. Maximum intensity projections are shown. Scale bar: 5 µm. These results were reproducible across 5 independent experiments. B) HeLa cells co-expressing AC-mito and the mCherry-mito control probe before and after treatment with LatB including example insets showing loss of AC-mito accumulation following LatB treatment. The yellow line in the merged inset indicates the area used to generate the line scan. The coefficient of variance was calculated before and after LatB treatment in the boxed region as described under Methods. Scale bar: 5 µm. These results were reproducible across 5 independent experiments. C) HeLa cells co-expressing AC-ER and the mCherry-ER control probe before and after treatment with LatB. The white box marks an area where AC-ER accumulation is lost following LatB treatment. The coefficient of variance for mCherry/AC-ER was calculated before and after LatB treatment in the white boxed region. Yellow arrows label areas of mCherry/AC-ER aggregation that result from LatB treatment. Higher magnification versions of some of these regions (marked by the yellow boxes) are shown in the bottom row. Scale bar: 5 µm. These results were reproducible across 5 independent experiments. D) FRAP-based quantificaton of mobile fractions before and after LatB treatment. FRAP was performed on cells co-expressing the mCherry-mito control probe and AC-mito (left graph) or the mCherry-ER control probe and AC-ER (right graph) before and after treatment with LatB. The mobile fraction of each probe was calculated and is displayed as a ratio of the mobile fracton after LatB treatment/the mobile fraction before LatB treatment. The AC probe mobility is increased following LatB treatment while the mobility of the corresponding mCherry control probes is unchanged. N = 7 cells per condition. P-values determined by two-tailed ratio paired t-test. These results were reproducible across 3 independent experiments.
