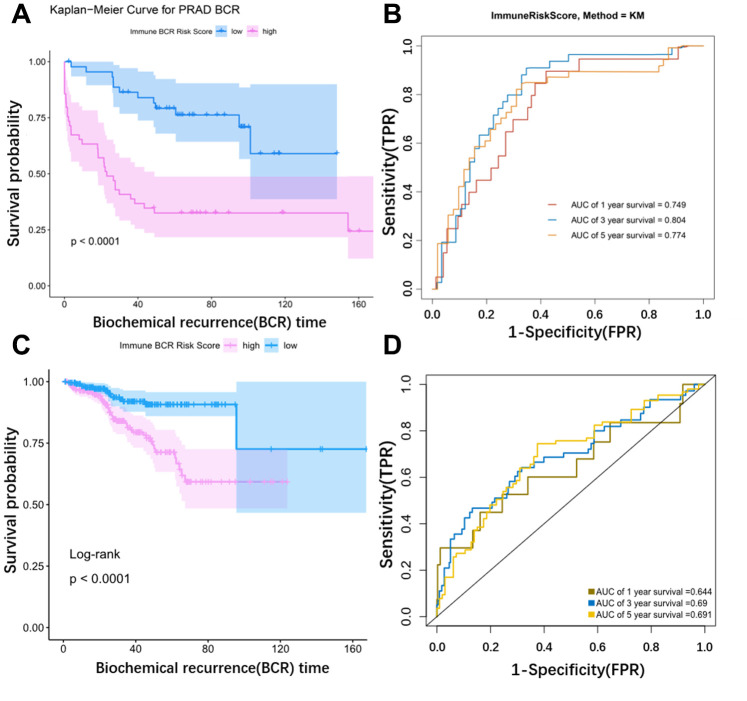
Figure 6.
Validation of the model using external data. (A) KM curve for the external dataset (GSE54460). (B) Time dependent ROC curves. The AUC (Area Under Curve) was 0.749 at 1 year, 0.804 at 3 years, and 0.774 at 5 years in the GSE54460 cohort. (C) KM curve for TCGA. (D) Time dependent ROC curves. The AUC (Area Under Curve) was 0.644 at 1 year, 0.69 at 3 years, and 0.691 at 5 years in the TCGA cohort.

