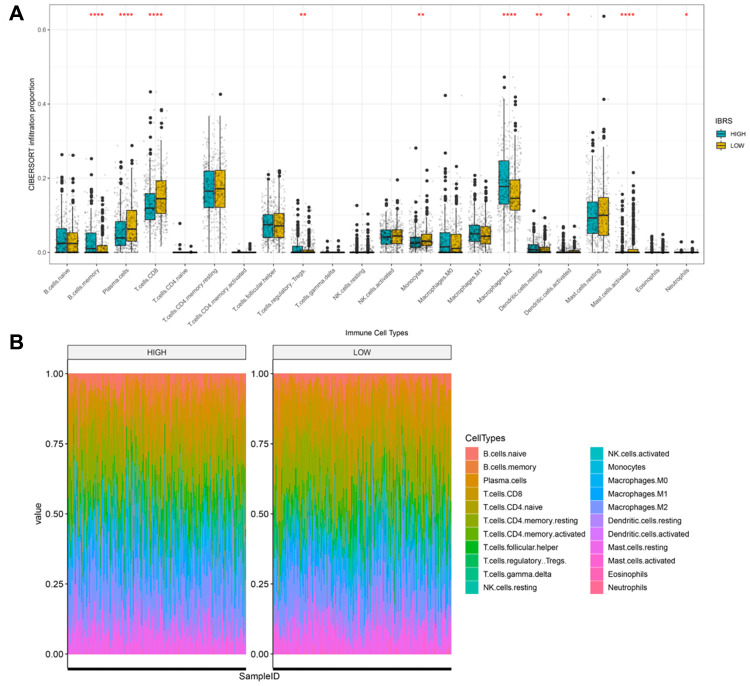
Figure 7.
Cibersort was used to calculate infiltration scores for 22 immune cell types based on the TCGA prostate cancer expression profile. (A) Infiltration differences (ratio) in high and low risk groups. ****p<0.0001, ***p<0.001, **p<0.01, *p<0.05. (B) Infiltration profiles in the high and low risk groups.

