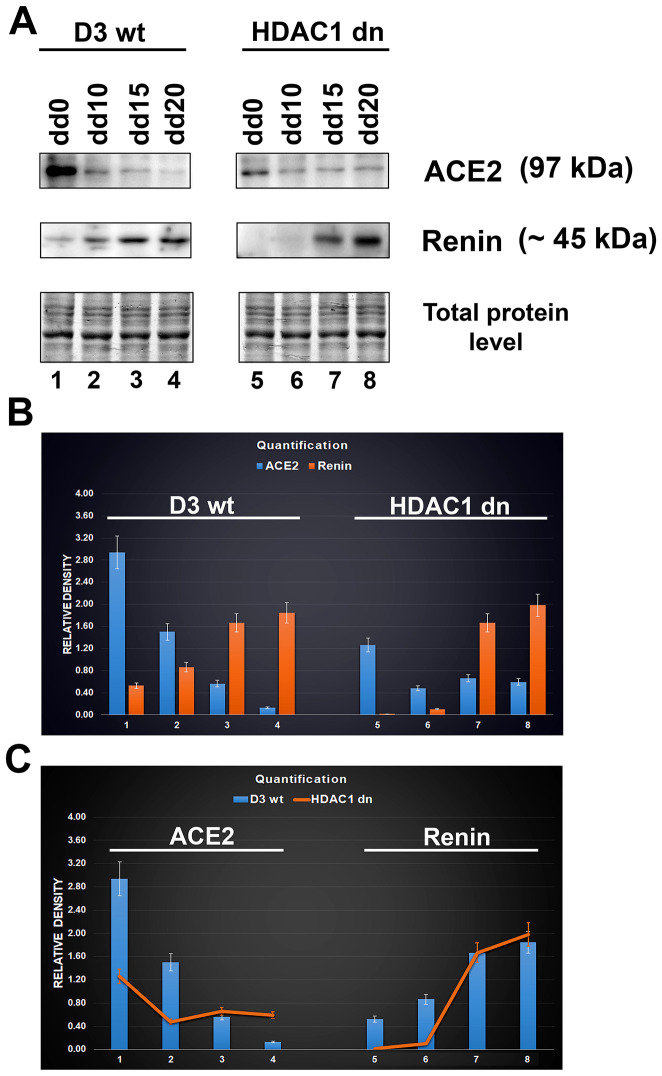
Figure 3.
Downregulation of ACE2 in mESCs undergoing differentiation into cardiomyocytes. (A) western blot analyses were performed in HDAC1 wt (D3 wt) and HDAC1-depleted (dn) mES cells, non-differentiated and differentiated into cardiomyocytes. The data show the levels of the ACE2 protein and renin normalized to the total protein levels. (B) Quantification of the protein levels, as assessed by western blotting, was performed using ImageJ software; the bar chart shows the comparison of protein levels in differentiated wt mESCs and differentiated HDAC1 dn mESCs. (C) The graphical illustration shows the comparison of ACE2 and renin (separately) in differentiated wt mESCs and differentiated HDAC1 dn mESCs.

