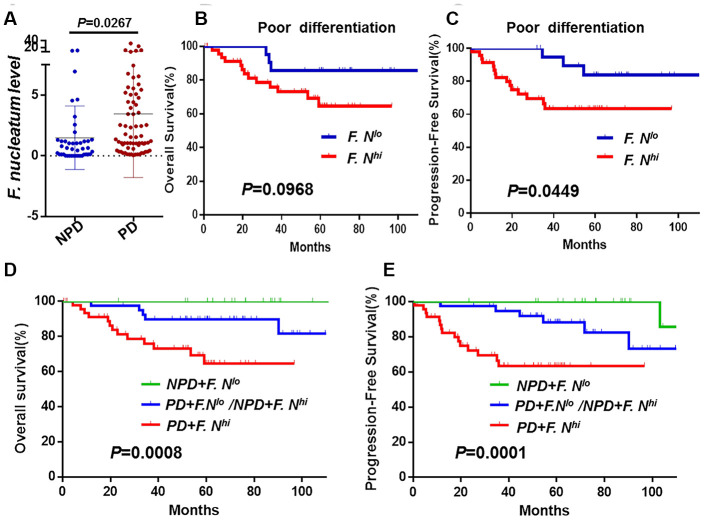
Figure 3.
The association between F. nucleatum levels and tumor histological differentiation. (A) F. nucleatum burdens in 112 tumors tissues. The mean amount of F. nucleatum was increased in poor (n = 69) differentiation tumors compared with well (n = 6) or moderate (n = 37) differentiation tumors. Data are expressed as mean±SD (bars); Kaplan-Meier analysis of OS (B) and PFS (C) for patients with high (red, n = 48) or low (blue, n = 21) F. nucleatum levels in poor differentiation (PD) cancer tissues; Kaplan-Meier analysis of OS (D) and PFS (E) for patients with poor differentiation and high F. nucleatum levels (red, n = 47, PD+F. nucleatumhi) vs. poor differentiation and low F. nucleatum levels or non-poor differentiation(NPD, well/moderate differentiation) and high F. nucleatum levels (blue, n = 40, PD+F. lo/NPD+F. hi) vs. NPD and low F. nucleatum levels (green, n = 24, NPD+F. nucleatumlo). Differences were assessed with an unpaired two-tailed t-test. The OS and PFS curves were generated by the Kaplan–Meier method and analyzed using the log-rank test.

