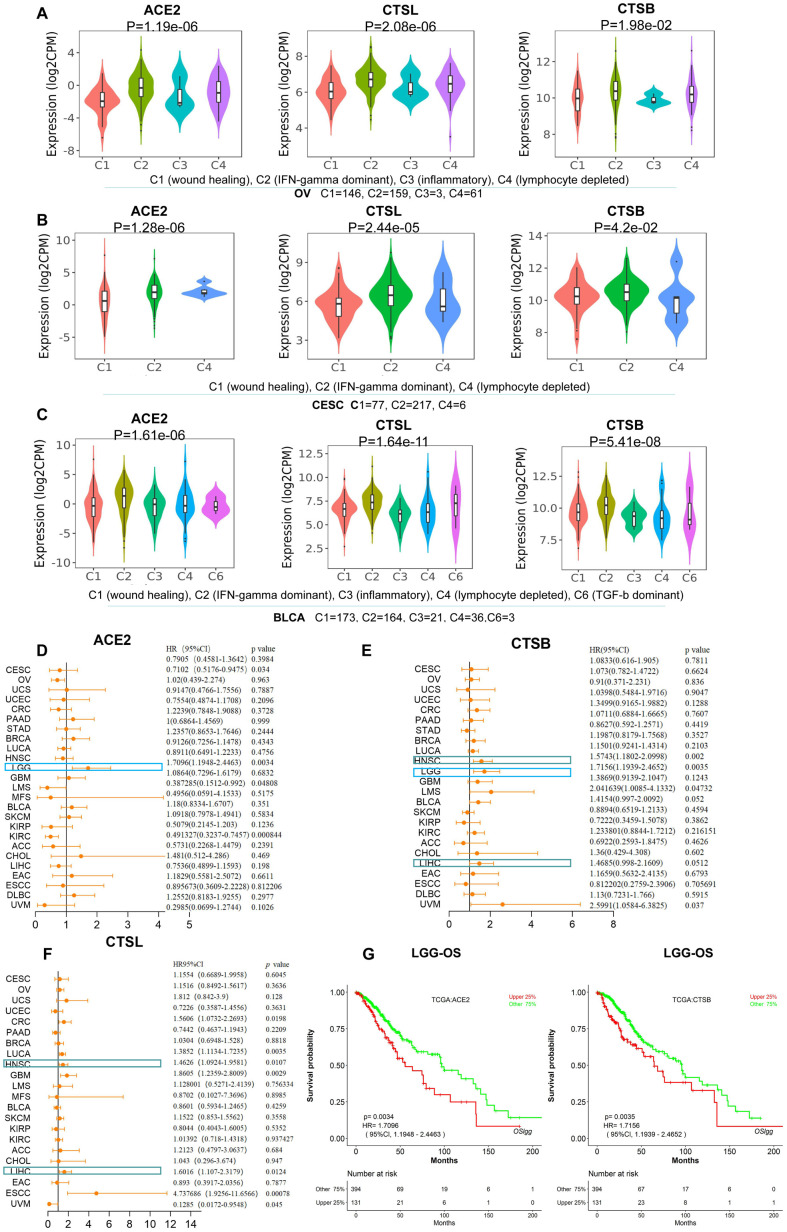
Figure 2.
The identification of immune subtypes and prognosis for CTSL/B and ACE2 in pan-cancer. (A–C) The distribution graphs of ACE2 and CTSL/B in six immune subtypes in OV, CESC and BLCA. ACE2 and CTSL/B in OV, CESC and BLCA were most highly expressed in the C2 named IFN-gamma dominant subtype. (D–F) Forest maps analysis of overall survival for ACE2 and CTSL/B in pan-cancer (LOGpc). The blue boxes represent the overlap of tumors in which ACE2 and CTSB can predict adverse prognosis; the green boxes represent the overlap of tumors in which CTSB and CTSL can predict adverse prognosis. (G) The overall survival analyses of ACE2 and CTSB in LGG utilizing the LOGpc online tool based on TCGA data, with results showing that ACE2 and CTSB both predict poor prognosis. p<0.05 was regarded as significant; HR>1, p<0.05 represented poor prognosis.

