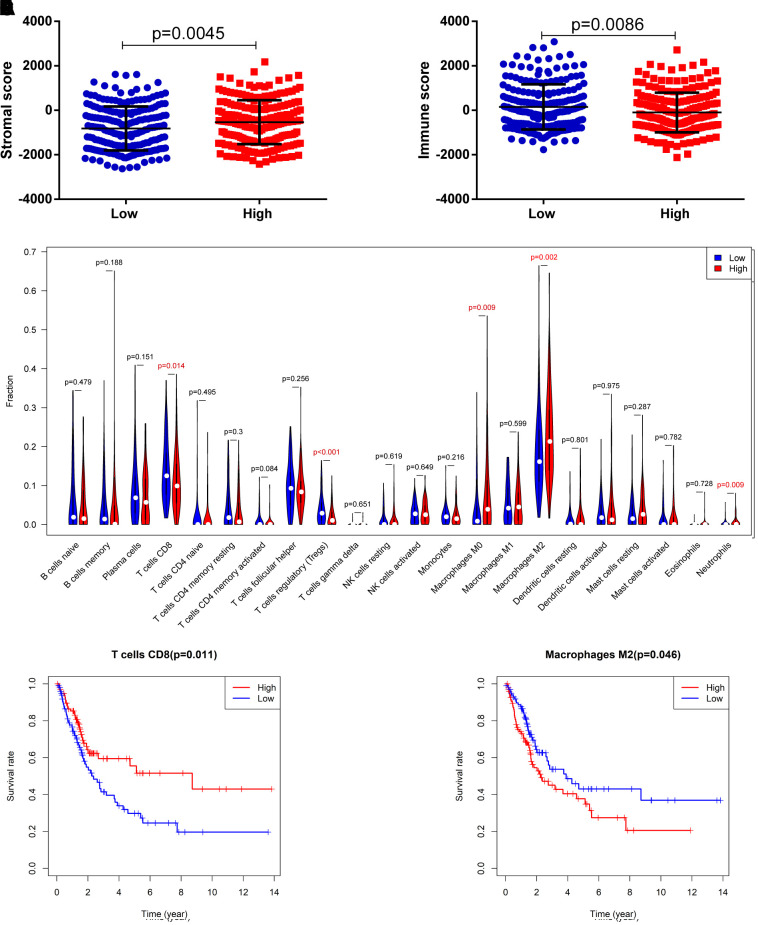
Figure 8.
Correlation of the 8-IRlncRNA signature with immune cell infiltration. (A) The stromal score in the low- and high-risk groups. (B) The immune score in the low- and high-risk groups. (C) The difference of 22 tumor-infiltrating immune cells among risk groups as defined by the 8-IRlncRNA signature. (D, E) The survival analysis for the abundance ratios of the T cells CD8 (D) and macrophages M2 cells (E). The red line indicates a high expressing group of immune cells, and the blue line indicates a low expressing group of immune cells.

