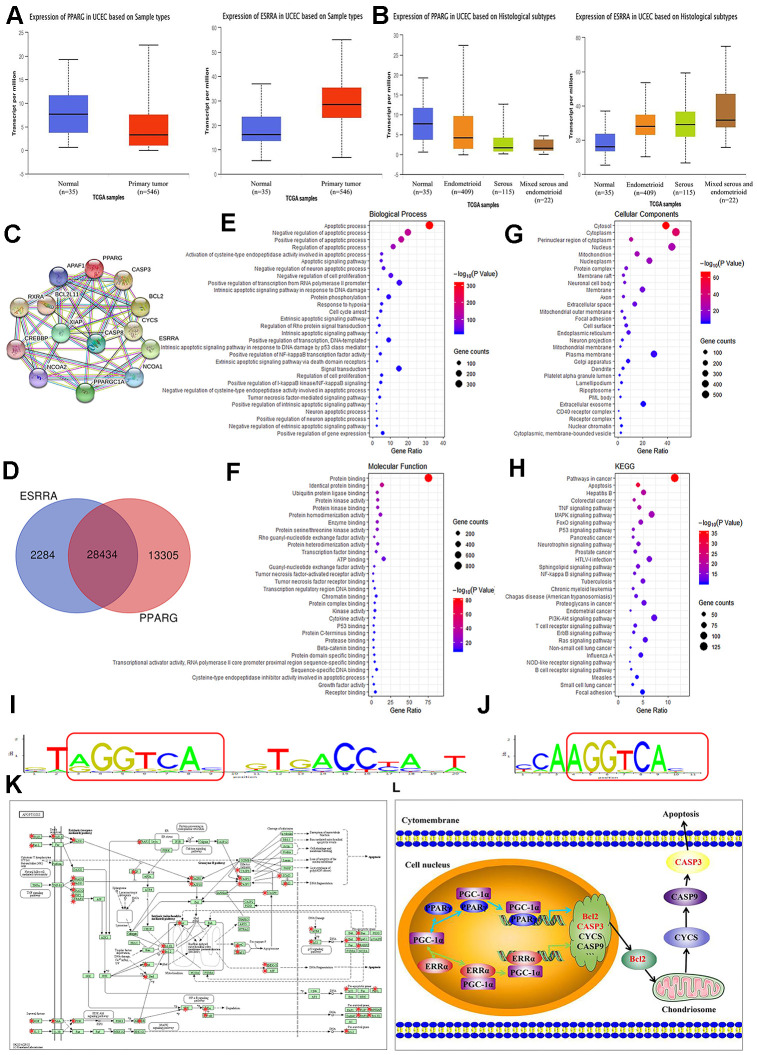
Figure 2.
Summary of functional annotation and pathway enrichment for PPARγ and ERRα. (A) Boxplot showing the relative expression of PPARγ and ERRα in normal and EC samples from the UALCAN database. (B) Boxplot showing the relative expression of PPARγ and ERRα in EC based on histological subtypes from the UALCAN database. (C) Protein mapping for PPARγ and ERRα based on string data. (D) Venn diagram showing the common target genes of PPARγ and ERRα. (E–G) GO enrichment of the common target genes of PPARγ and ERRα. (H) KEGG enrichment of the target genes regulated by PPARγ and ERRα. (I) The ModFit of PPARγ based on the JASPAR database. (J) The ModFit of ERRα based on the JASPAR database. (K) KEGG pathway maps for apoptosis; The red dots represent target genes of PPARγ and ERRα. (L) Possible mechanism of interaction between PPARγ and ERRα. EC, endometrial cancer. *, P<0.05; #, P>0.05.

