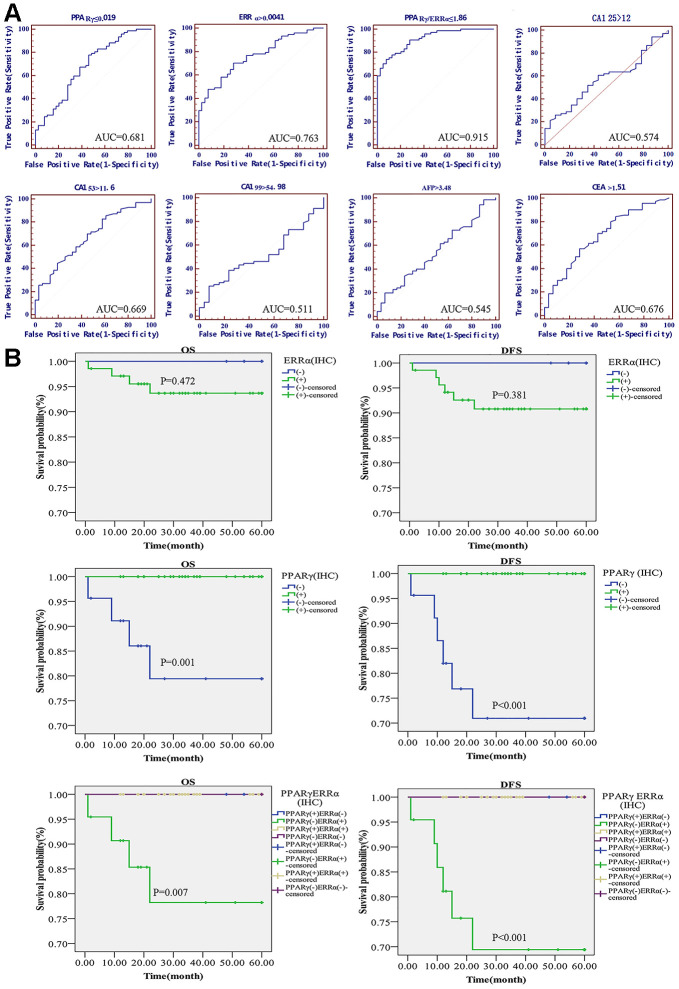
Figure 5.
Diagnostic and prognostic value of the PPARγ/ERRα ratio for EC. (A) ROC curves of the mRNA expression of PPARγ, the mRNA expression of ERRα, the PPARγ/ERRα ratio, CA125, CA199, CA153, CEA, and AFP. (B) DFS and OS in EC patients with different expression patterns of PPARγ/ERRα. Patients with PPARγ(+)/ERRα(-) had longer DFS and OS. The mRNA expression of PPARγ and ERRα was quantified using the 2-ΔCT method. PPARγ/ERRα was quantified as the ratio of the mRNA expression of PPARγ to the mRNA expression of ERRα. ROC, receiver operating characteristic; DFS, disease-free survival. OS, overall survival.

