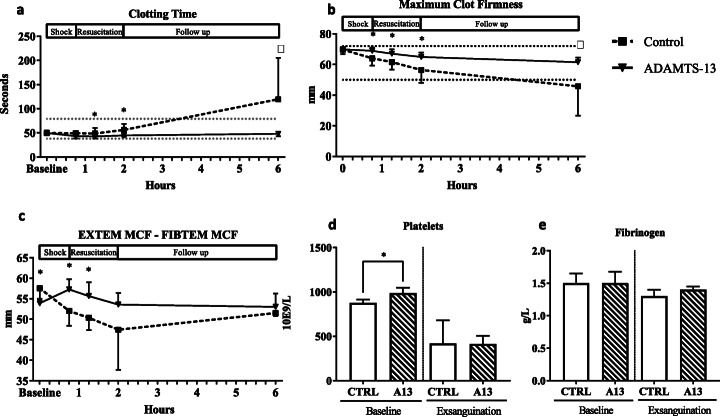
Fig. 2.
Coagulation parameters. a Clotting time measured in EXTEM array over time. b Maximum clot firmness measured in EXTEM array over time. c Maximum clot firmness of EXTEM and FIBTEM assay subtracted as a reflection of platelet-driven coagulation. d Platelet counts at baseline and exsanguination. e Fibrinogen levels at baseline and exsanguination. ROTEM values presented as mean and standard deviation (SD). Reference values are according to human standards. Platelet count and fibrinogen levels are presented as median and interquartile ranges (IQR). *p < 0.05

