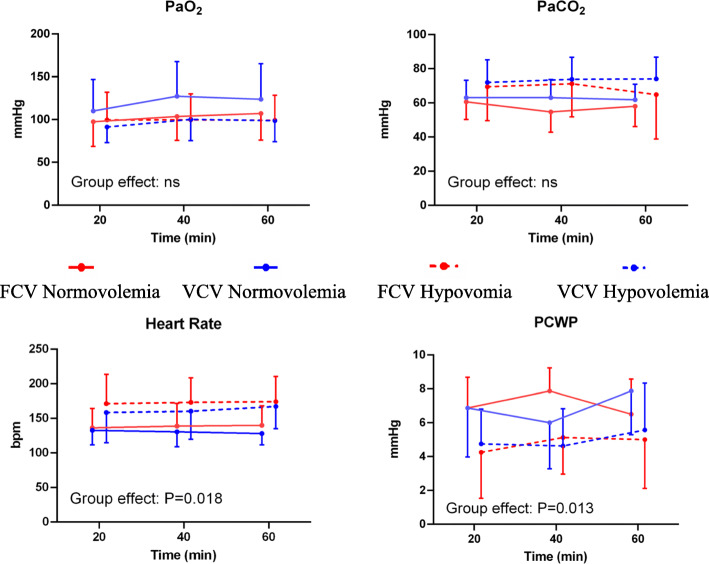
Fig. 2.
Gas exchange and haemodynamics. Symbols and vertical lines represent mean and standard deviation. Global statistical significance was accepted at P < 0.05. Differences between the two groups and the two ventilation strategies were compared using linear mixed-effects, repeated measures ANOVA. FCV = flow-controlled ventilation; VCV = volume-controlled ventilation; ns = not significant, PaO2 = arterial oxygen pressure; PaCO2 = arterial carbon dioxide pressure; PCWP = pulmonary capillary wedge pressure

