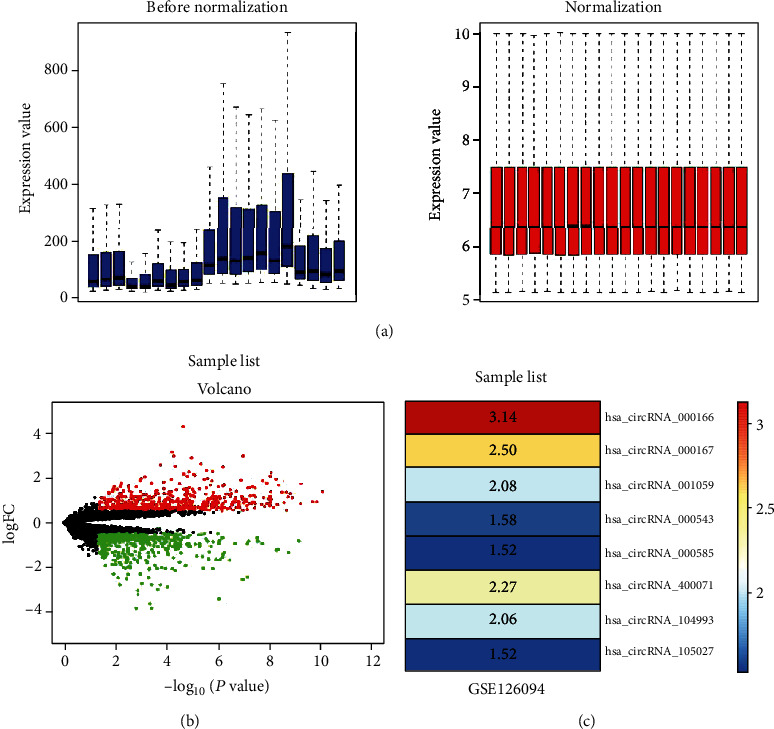
Figure 1.

Microarray data information and DEG analysis in colorectal cancer. (a) The standardization of GSE126094 data. The data before normalization were displayed as the blue bar, while the normalized data were shown as the red bar. (b) The volcano plots of GSE126094 data. The red and green points, respectively, represented upregulated and downregulated genes screened on the basis of ∣fold change (FC) | >2.0 and a corrected P value < 0.05. Genes with no significant difference were shown as the black points. (c) The abscissa was defined as GEO ID, and the ordinate was defined as the gene name. The values in the box represent the log FC values. ANOVA test was used for statistics.
