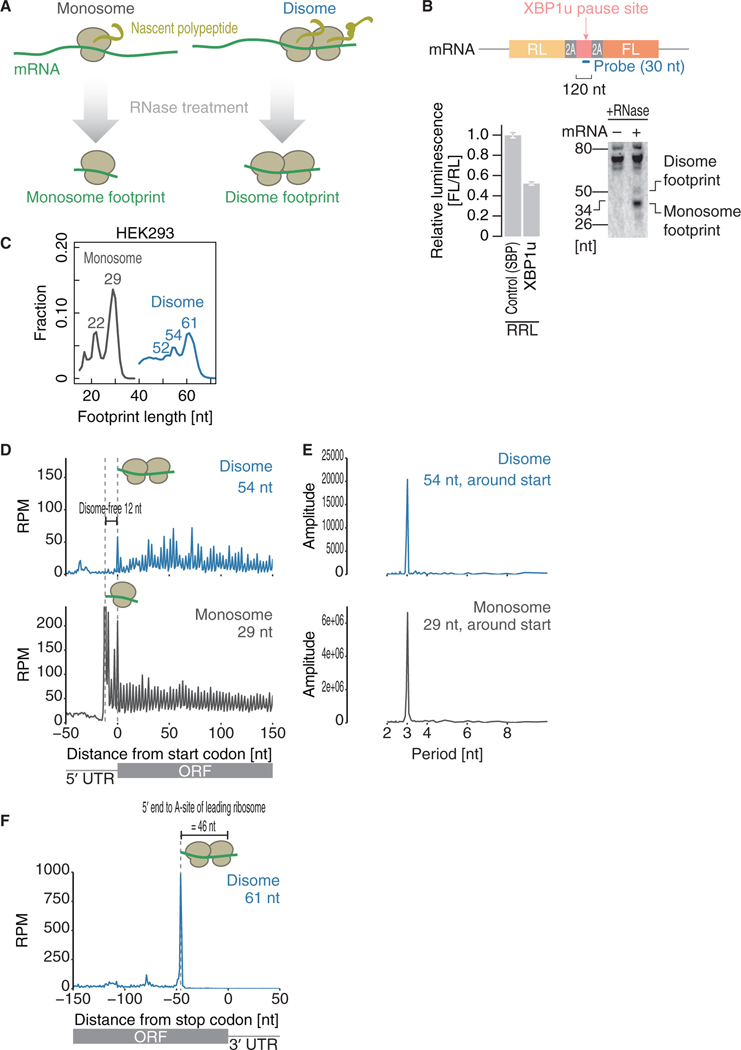
Figure 1. Disome Footprints Reflect the Collision of Ribosomes.
(A) Schematic representation of disome profiling.
(B) Northern blot of footprints generated by stalled ribosomes on the XBP1u pause site in rabbit reticulocyte lysate (RRL) (bottom right). Schematic representations of a reporter and designed probe are shown (top). As a control, the streptavidin-binding peptide (SBP)-tag was replaced with the XBP1u pause site. The XBP1u pause site and control SBP-tag were sandwiched by self-cleavage 2A sequences. Thus, the readout from upstream Renilla luciferase (RL) and downstream firefly luciferase (FL) could directly reflect the net translation and avoid cotranslational protein degradation, if any, in the cell-free translation system. Translation attenuation by the XBP1u pause site verified the ribosome stalling (bottom left). Data represent the mean and SD (n = 3).
(C) Distribution of the lengths of fragments generated by monosome profiling (regular ribosome profiling, gray line) and disome profiling (blue line) in HEK293 cells.
(D and F) Metagene analysis showing the 5’ ends of fragments of the indicated read lengths around start codons (D) and stop codons (F). The position of the first nucleotide in the start or stop codon is set as 0.
(E) Discrete Fourier transform of reads showing their periodicity around start codons.
RPM, reads per million mapped reads.
See also Figures S1 and S2.

