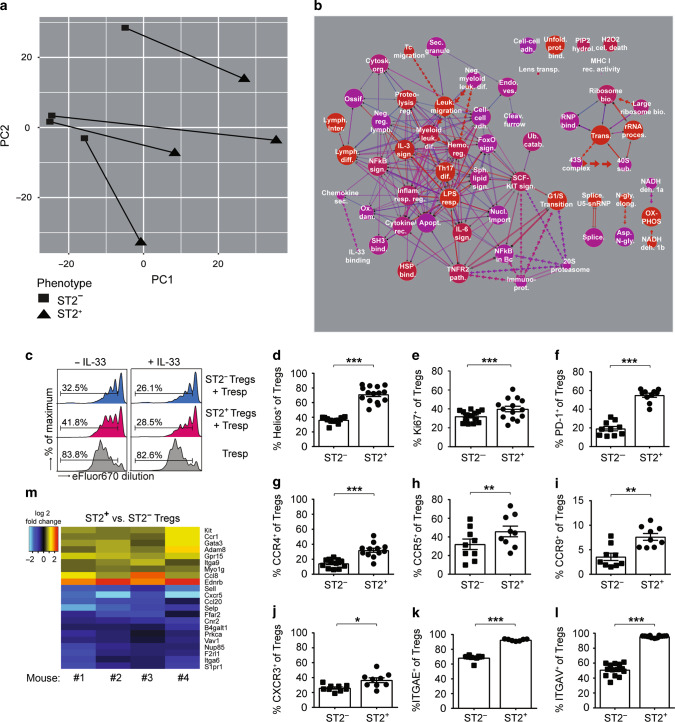
Fig. 4.
ST2 expression shapes the transcriptome and the phenotype of tumor-derived FOXP3+ Tregs. Foxp3/eGFP mice were treated with AOM/DSS and eGFP+ CD4+ T cells from CRC lesions were sort-purified into ST2+ versus ST2− cells for microarray analysis. a Principal component analysis depicting matched samples, connected by lines, from four analyzed mice. b Pathway analysis showing 58 pathways that were found to be differentially regulated between ST2+ versus ST2− eGFP+ CD4+ T cells (with adjusted p-value p < 0.001 and corrected p-value p < 0.001). Graph key: red color indicates increased significance and blue (purple) no significance. Size of circles is proportional to the number of genes within a pathway. Connection lines indicate pathways that share genes. Thickness of connecting lines is proportional to the number of genes shared between two pathways. Double lines indicate that the intersection between two pathways is significant. Dotted arrow lines indicate that a particular pathway corresponds to a subset within another pathway. Line length has no particular meaning. Full pathway names, detailed results, and references for the different pathways are shown in Supplementary Table 1. c To assess their suppressive capability, sort-purified ST2− and ST2+ eGFP+ Tregs were co-cultured at a 1:2 ratio with anti-CD3-activated responder St2−/− T cells (Tresp), together with St2−/− antigen-presenting cells, in the presence or absence of IL-33. Proliferation of Tresp was analyzed after 3 days, based on the extent of eFluor670 fluorescence dilution. Histograms show one representative out of three independent experiments. d–l ST2− and ST2+ Tregs (defined as CD4+ FOXP3+ T cells) were analyzed for expression of the indicated markers (n = 7–15 mice per group, pooled from 2 to 3 independent experiments). m Heat map showing all genes in the gene ontology pathway “leukocyte migration” (GO:0050900) that are differentially expressed in ST2+ versus ST2− eGFP+ Tregs isolated from CRC lesions from the indicated four mice (adjusted p-value p ≤ 0.05). Blue indicates higher transcript expression in ST2– Tregs and red higher expression in ST2+ Tregs. d–l Data are mean ± SEM and statistical analyses were performed using paired Student’s t-test. *P < 0.05; **P < 0.01; ***P < 0.001

