Fig. 5.
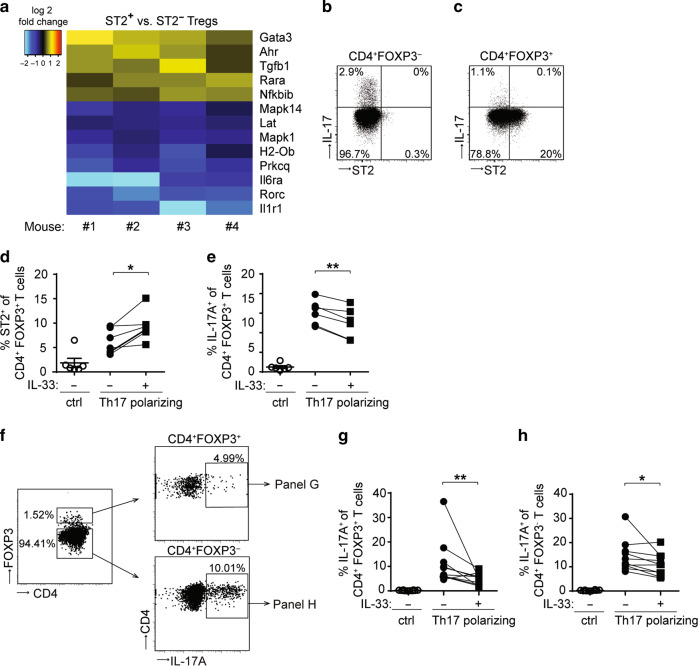
IL-33 restrains IL-17 production in CD4+ T cells. a Foxp3/eGFP mice were treated with AOM/DSS and eGFP+ CD4+ T cells were isolated from CRC lesions for transcriptomic analysis. Heat map showing all genes in the gene ontology pathway “Th17 cell differentiation” (ko04659) that are differentially expressed in ST2+ versus ST2− eGFP+ Tregs isolated from CRC lesions from the indicated four mice (adjusted p-value p ≤ 0.05). Blue indicates higher transcript expression in ST2− Tregs and yellow/red higher expression in ST2+ Tregs. BALB/c mice were treated with AOM/DSS and FOXP3− CD4+ T cells b or FOXP3+ CD4+ Tregs c were analyzed in the intestine for ST2 and IL-17 expression. Shown are flow cytometry plots from each one representative sample out of three. d–h Sort-purified eGFP+ b, c or eGFP− d, f CD4+ T cells from spleens of naïve Foxp3/eGFP reporter mice were stimulated with anti-CD3/anti-CD28 antibodies (ctrl) or cultured under Th17 polarizing conditions in the presence or absence of IL-33. d Frequencies of ST2-positive or e IL-17A-positive cells were measured among CD4+ FOXP3+ Tregs. f Flow cytometry plots from one representative experiment showing the gating strategy applied to assess the proportion of IL-17A-expressing cells among FOXP3+ (right upper panel) or FOXP3- CD4+ T cells (right lower panel). In this particular dataset, eGFP− CD4+ T were cultured under Th17-polarizing conditions, in the presence of IL-33. Frequencies of IL-17A-expressing cells were measured among g CD4+ FOXP3+ Tregs or FOXP3− CD4+ T cells h. d, e Data are mean ± SEM and were pooled from two representative experiment (n = 6 mice). Statistical analyses were performed using paired Student’s t-test. g, h Data are mean ± SEM (n = 10 mice, pooled from three independent experiments) and statistical analyses were performed using Wilcoxon matched-pairs signed rank test. *P < 0.05; **P < 0.01

