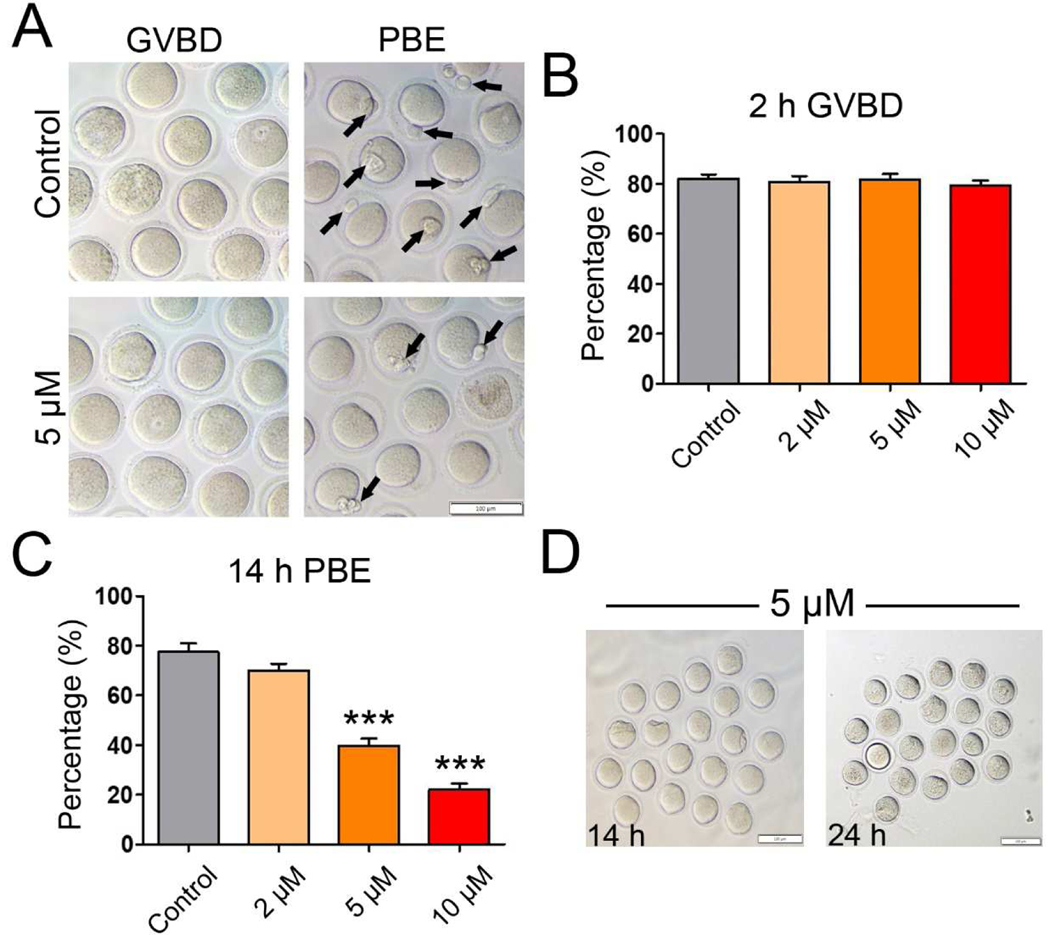
Figure 1. IAA exposure disrupted mouse oocyte maturation in vitro.
(A) Representative images of oocytes with GVBD (2-h) and PBE (14-h) in the untreated control and IAA-treated groups (5 μM). The arrows highlight the oocytes with PBE. Scale bar, 100 μm. (B) The rates of GVBD in the untreated control and IAA-treatment groups (2 μM, 5 μM, and 10 μM) after 2-hour culture. (C) The PBE rates in the untreated control and IAA-treated groups (2 μM, 5 μM, and 10 μM) after 14-hour culture. (D) Representative images of the PBE-failure oocytes selected from the 5-μM-IAA-treated group that have been cultured for 14 h (left panel), continuing another 10-h culture (right panel). Note: No selected oocytes (n=20) extrude their polar bodies after 24-h culture. Scale bars, 100 μm. A total of 120 oocytes in the control, 119 oocytes in the 2 μM group, 120 oocytes in the 5 μM group, and 120 oocytes in the 10 μM group were analyzed for GVBD and PBE rate. Data were presented as mean ± SEM of at least three independent experiments. ***P < 0.001, compared with control.

