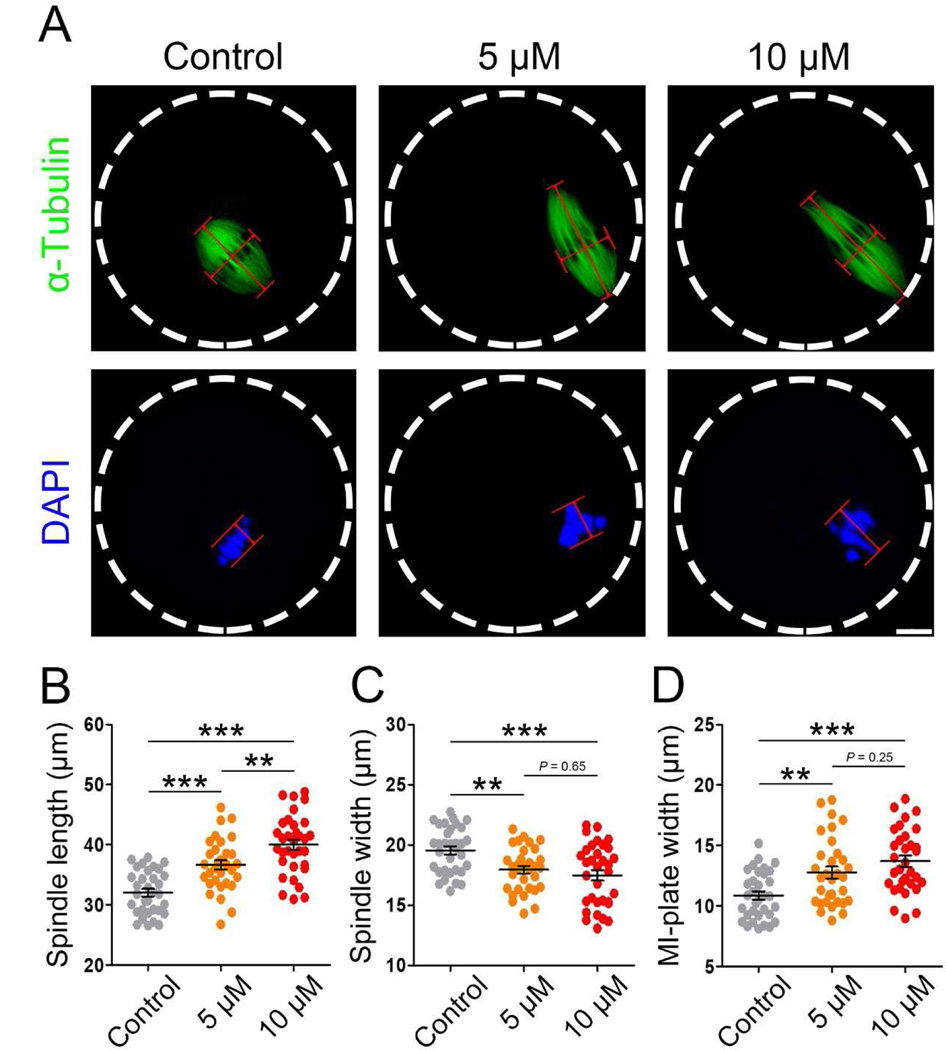
Figure 3. IAA exposure induced abnormalities of spindle assembly and chromosome alignment in MI mouse oocytes.
(A) Representative images of MI spindle morphologies in the control, 5 μM and 10 μM IAA-exposed oocytes. Spindle length was calculated by the distance from one spindle pole to the other. Spindle width was represented by the width of microtubules at the MI plate. MI plate width was measured by the axis distance between the two lines at the edges of the DNA. α-tubulin, green; chromosomes/DNA, blue. Scale bar, 10μm. (B) Quantitative analysis (mean ± SEM) of the meiotic spindle length in three treatment groups. (C) Quantitative analysis (mean ± SEM) of the meiotic spindle width in three treatment groups. (D) Quantitative analysis (mean ± SEM) of the MI-plate width in three treatment groups. A total of 33 oocytes in the control, 32 oocytes in the 5 μM group and 33 oocytes in the 10 μM group were used for spindle length and width analysis; A total of 33 oocytes in the control, 32 oocytes in the 5 μM group and 32 oocytes in the 10 μM group were used for MI-plate width analysis. *P < 0.01, ***P < 0.001, compared with control. *P < 0.01, 5 μM versus 10 μM.

