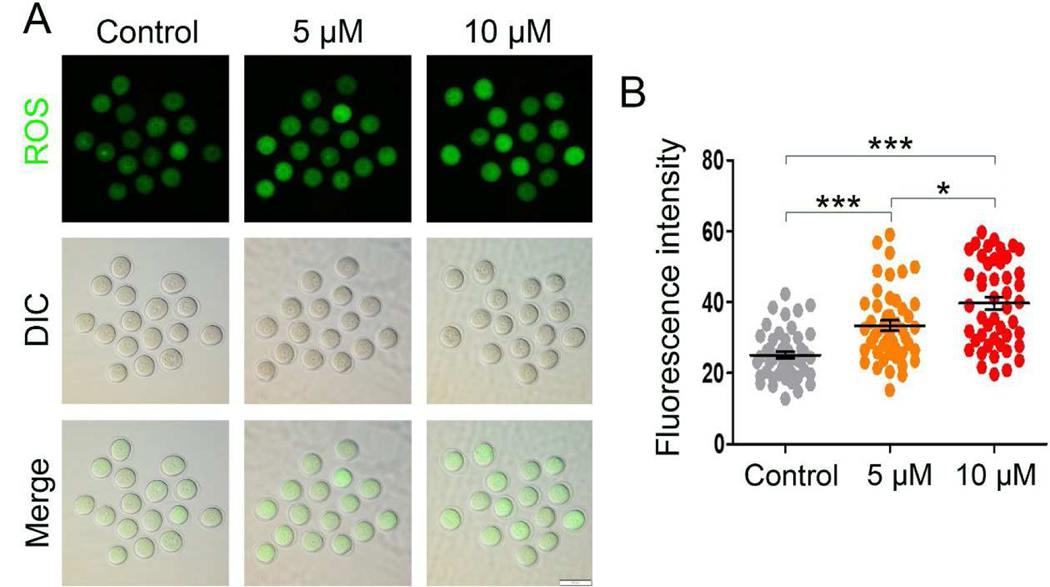
Figure 4. IAA exposure increased the ROS level in mouse oocytes.
(A) Representative images of DCHF-DA fluorescence (green) in the control and IAA (5 μM and 10 μM)-treated oocytes. DIC, differential interference contrast. Scale bar, 100 μm. (B) Quantitative analysis of DCHF-DA fluorescence intensity in the control and IAA (5 μM and 10 μM)-exposed groups. A total of 46 oocytes in the control, 47 oocytes in the 5 μM group, and 47 oocytes in the 10 μM group were used for analysis. Data were presented as mean percentage (mean ± SEM) of at least three independent experiments. ***P < 0.001, compared with control. *P < 0.05, 5 μM versus 10 μM.

