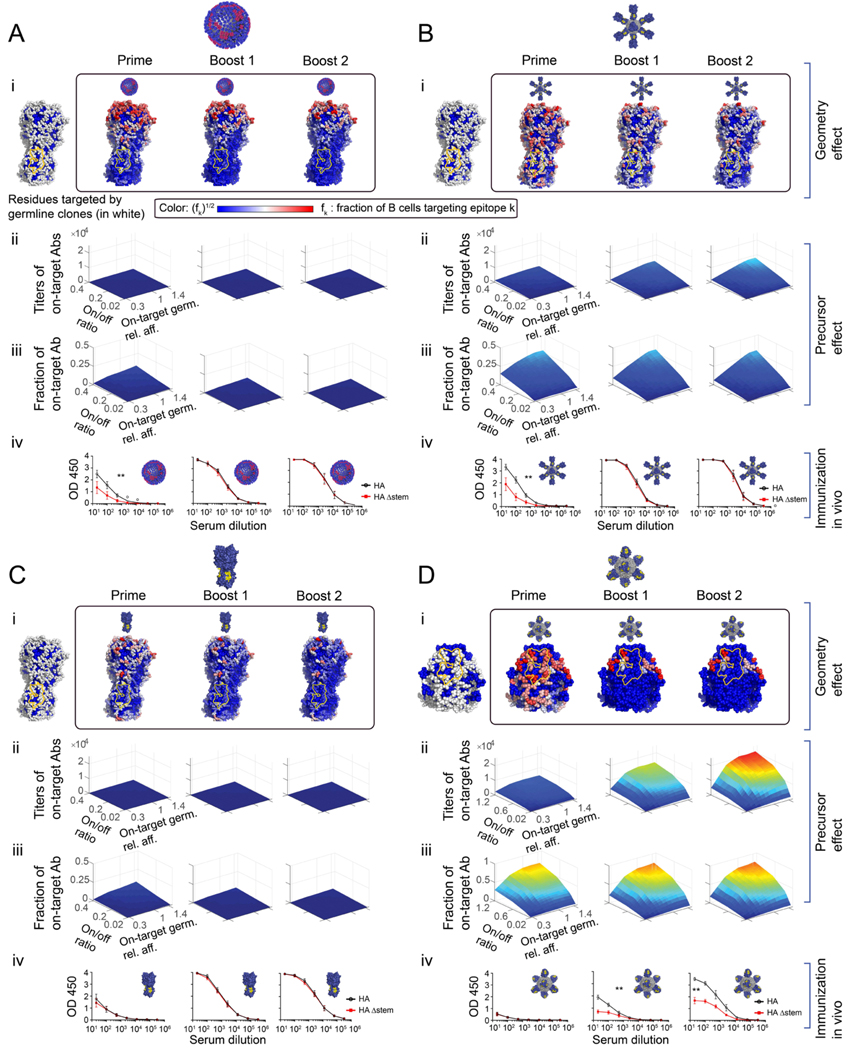
Figure 4. Immunogenicity heatmaps developed in silico predict immunodominance patterns in vivo.
(A) Influenza virus. (B) HA-np. (C) HA trimer alone. (D) SS-np. HA heatmaps were developed in silico for each HA presentation geometry where the Group 1 bnAb epitope is marked in yellow. (panels i). To account for geometric effects alone, the B cell precursor frequency was made uniform for every epitope on the surface of HA (A-C), or over the stem surface (D) (panels i, left). Next, we report heatmaps following sequential immune challenge in silico, where fi of memory B cells targeting different residues created post-prime (i, box, left), post-boost1 (i, box, middle), and post-boost 2 (i, box, right). To increase the visibility of residue targeted by a small fraction of B cells, the color shows fi1/2 where red sites are targeted by the largest number of B cells color bar. White sites are targeted by an intermediate number, and blue sites are targeted by few or no B cells. (Panels ii-iii). The magnitude of the on-target response elicited by different HA geometries as a function of precursor frequency and affinity (= geometry effect + precursor frequency and affinity consideration). The initial fraction of on-target precursors was expressed as the ratio of on-target germline clones (specific for Group 1 bnAb target), to HA-specific off-target germline clones (=on/off ratio) (see also Method Details “Setting clonal precursor frequency”, Eq.(21), Figure S1D), or stem-specific off-target germline clones (Eq.(20)). The result of sequential immunization in silico plotted as a function of: the average on-target germline affinity (off-rate) relative to the off-target germlines affinity (x-axis), the on/off ratio(y-axis), and on-target antibody response titer (z-axis). The color map (blue to red) corresponds to the number of memory B cells targeting the conserved epitopes elicited by the immunogen. influenza virus (A-ii), HA-np (B-ii), HA-trimer (C-ii), and SS-np (D-ii). (Panel iii) The fraction of B cells targeting the conserved epitopes compared to all memory B cells created during the simulation. (Panels iv) Experimental validation in mice. To test our predictions in vivo, we sequentially immunized with homologous preparations of these same HA presentations within IGHV1–69 humanized mice bearing human-like CDRH3 diversity (Sangesland et al., 2019). Mice were sequentially immunized or infected with NC99 virus (A-iv) or HA-np (B-iv) or HA trimer (C-iv), or SS-np (D-iv) at weeks 0, 3, and 6 and sampled for blood at weeks 2 (post-prime), 5 (post-boost 1), and 8 (post-boost 2). Epitope-targeting was assessed by the binding of serum IgG to HA (black line) vs HAΔstem (red line). Mean and SEM values for reactivity to HA vs HAΔstem are shown for each time point (n=5 animals per regimen). Area under the curve (AUC) values were compared using the AUC comparison method of Hanley and McNeil (Hanley and McNeil, 1983) which includes a correction for curves derived from the same subject and was applied to test the two-sided null hypothesis that the there is no difference between the curve areas (**P<0.03, A-C, or **P<0.002 D).

