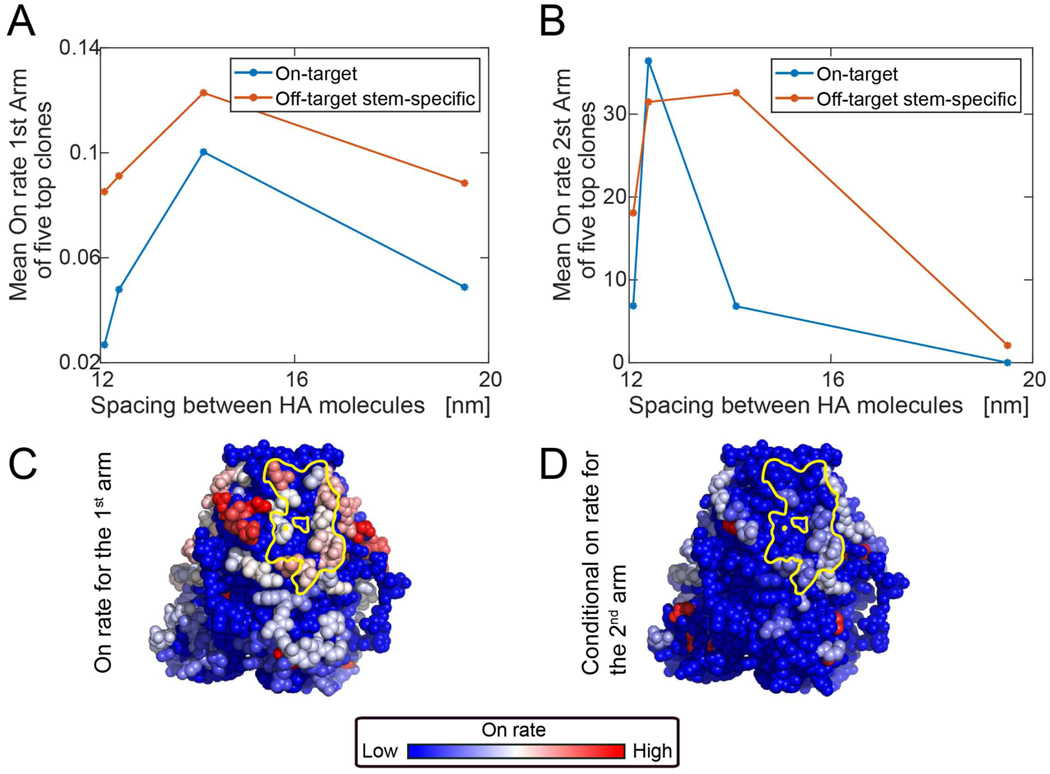
Figure 6. On-rate of the BCR to the epitopes for different HA spacing on influenza virus.
Coarse-grained MD simulation to estimate the mean first passage time of the antibody to different HA residues by varying spike spacing at the viron surface. [reported value is 14 nm (Harris et al., 2013)] (A) The average on-rate for the first arm for the five clones with the highest first-arm on-rate Average for the top five on-target clones (blue). Average for top five off-target clones (red). (B) The average on-rate for the second arm, given that the first arm is bound for the five clones with the highest first-arm on-rate. On-target (Group 1 bnAb-epitope targeting; blue curve) and off-target (red curve). (C,D) BCR on-rates within the stem region (full virus with 56 HA surface molecules with spike spacing of 12.5 nm). The on-rate of the first arm to red sites is high, intermediate to white sites, and low for blue sites and was the average of multiple simulations (see Eq.(5)). The Group 1 bnAb epitope is marked in yellow. Second arm binding was measured as on-rate to the second site, given that the first site is already bound (see Eq.(6)).

