
Figure 1:
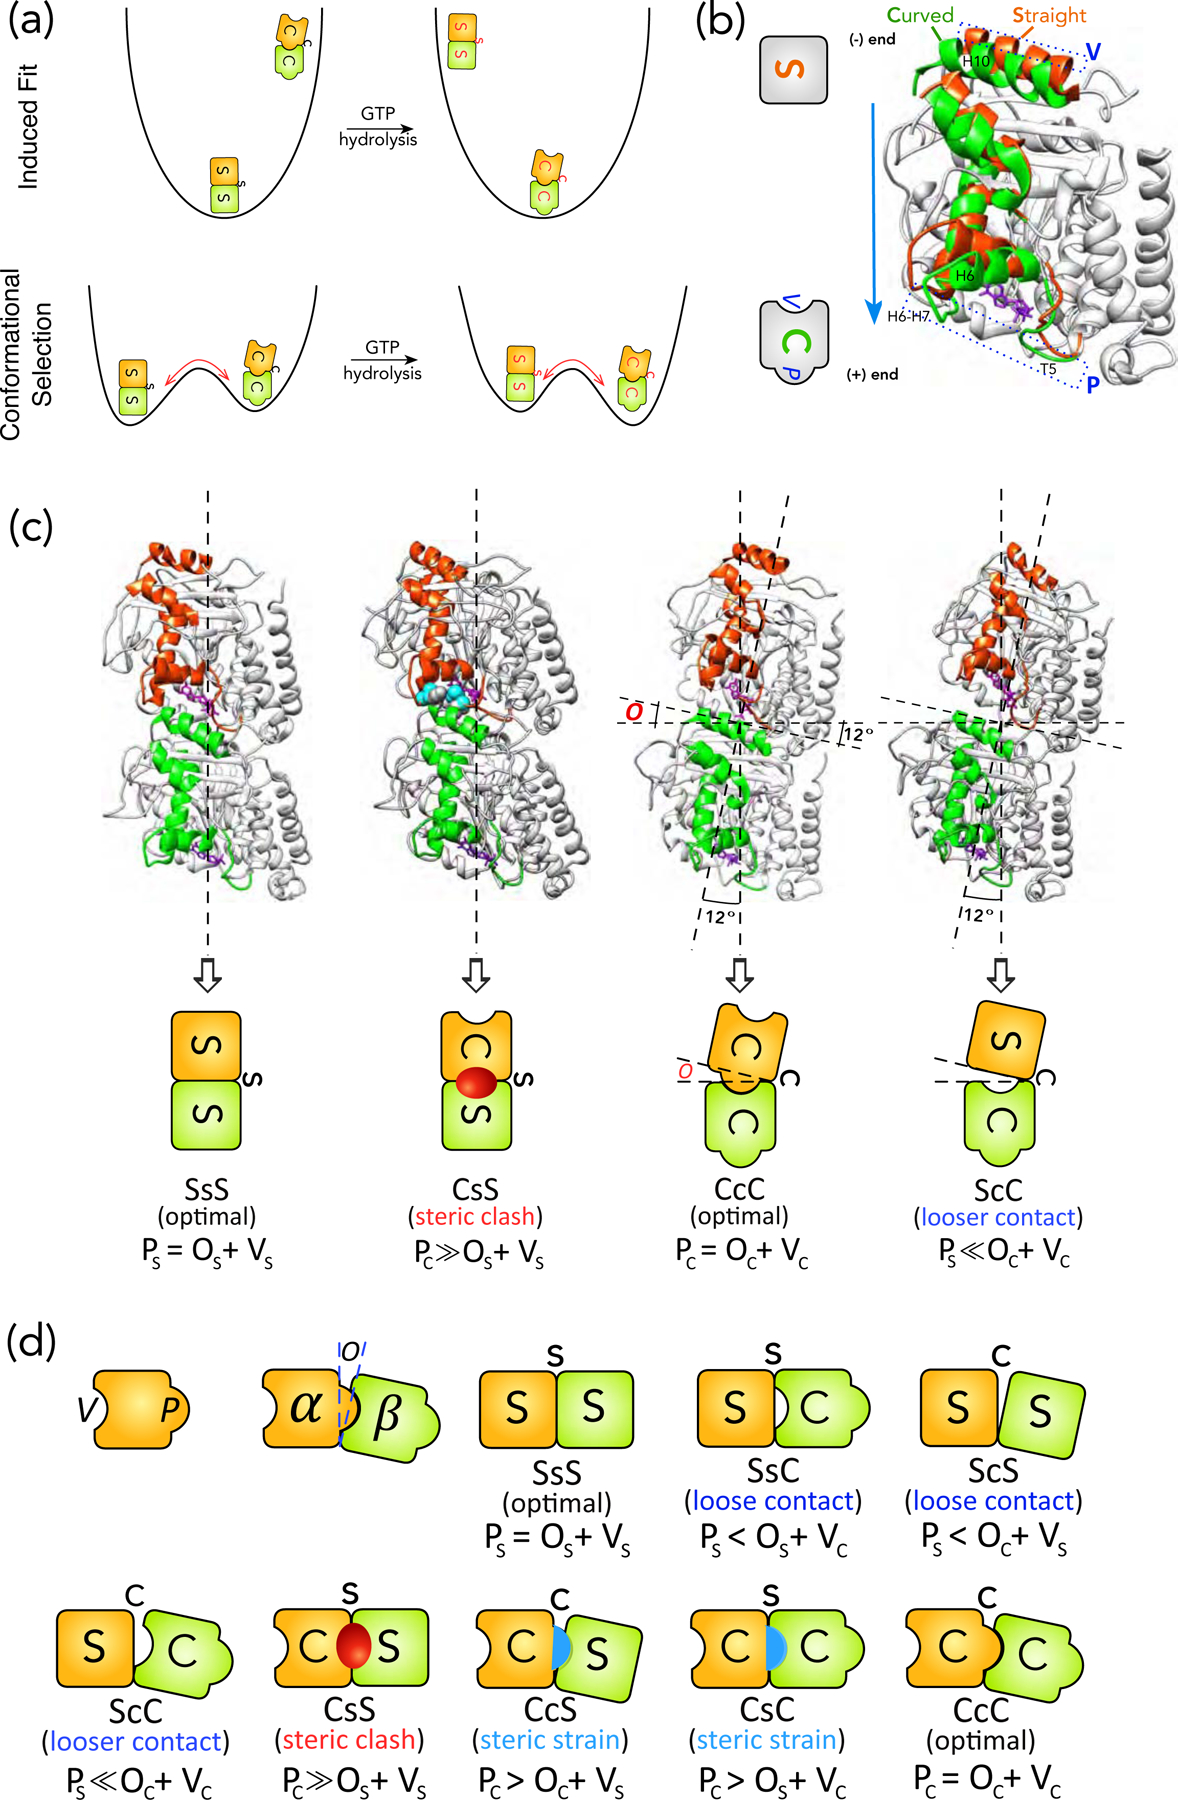
Schematics of structural intermediates in S→C transition. (a) Comparison of the physical pictures of induced-fit and population shift using the energy landscape for S→C transition of a tubulin dimer in a MT as an example. The induced-fit hypothesis suggests that, in the GTP state, the only stable state (i.e. a basin in the energy landscape) is the S form, whereas the C form is unstable. After GTP-hydrolysis, the C form becomes the stable state, whereas S form becomes unstable and will convert into the C form within one vibrational cycle. This is the physical picture behind the assumption by VanBuren et al. The red arrow points to the direction of conformational change. In contrast, the population shift hypothesis suggests that both S and C forms are stable in both GTP and GDP states, but their stabilities change with the nucleotide state. The transition between S and C forms in both nucleotide states need to surmount a free energy barrier and the barrier height determines the time scale of the corresponding transition. (b) Definition of the protrusion (P) and cavity (V) based on comparison between the S and C forms of a tubulin monomer. The S (PDB 1jff) and C (PDB 1sa0) forms of a β-monomer are aligned by their NTD and CTD, following the procedure by Ravelli et al. The structural elements that moves significantly in S→C transitions are highlighted in Orange (S form) and Green (C form) respectively. The rest are colored light Grey. The movement of loops T5 and H6–H7 towards the plus-end side of the monomer leads to P (Blue dashed rectangle at the bottom). The movement of helix H10 leads to V (Blue dashed rectangle at the top). The GDP is shown as stick representation in Purple. The cartoon representations for S and C forms are shown on the left, with both P and V marked. (c) The structures for SsS (PDB 1jff), CcC (PDB 1sa0), CsS and ScC conformations of tubulin dimer and their corresponding cartoon representations (video S3). We use upper case for monomer (i.e. S, B, C) and lower case for interface (i.e. s, b, c) conformations: SsS denotes a dimer or an intra-dimer interface in S form, with the minus-end side on the left. To distinguish an inter-dimer interface, we put hyphens on its two sides: S-s-S indicates an inter-dimer interface. Since hydrolysis only modifies the nucleotide of β-monomer, we use a superscript for the nucleotide state of the β-monomer when necessary: T for GTP and D for GDP (e.g. S-s-SD represents an inter-dimer interface with a GDP-bound β-monomer). For the two types of lateral bonding, we use “e” for sheet-like and “t” for tube-like bonds respectively (e.g. BeB means two monomers in B form sharing a sheet-like lateral bond). The opening (O) is defined by the angle between the major axes of the two monomers in a dimer, which is 12° for CcC and 0° for SsS conformation. The CsS conformation is created by replacing the α-monomer in a SsS dimer with an α-monomer in C form by aligning their NTDs and CTDs. The residues that have steric clashes with each other (their van der Waals radii significantly overlap) are shown in sphere representation in light Blue (α-monomer) and dark Grey (β-monomer) respectively. In the cartoon for CsS conformation, the Red oval represents the steric clashes. The ScC conformation is created by replacing the α-monomer in a CcC dimer with an α-monomer in C form by aligning their NTDs and CTDs. (d) The cartoon representations for all the eight possible structural intermediates for S→C transition of a tubulin dimer. The Red oval and Blue half oval represent steric clashes and strains between two monomers respectively.