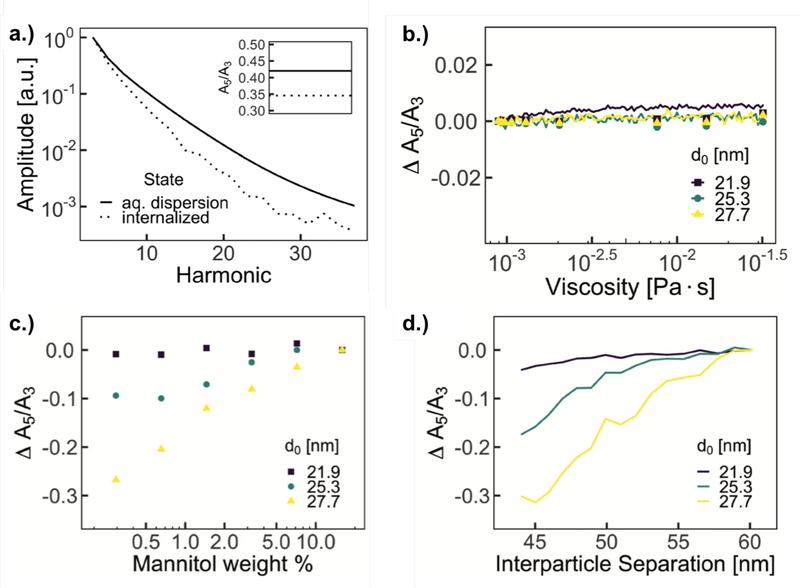
Figure 15:
a. Comparison of pre- and post-internalization MPS harmonic distribution in cells (with inset A5/A3) b. Magnetic particle spectroscopy performance, A5/A3, as a function of solution viscosity of three different batches of magnetite nanoparticles. Simulation results, shown as lines, of equivalent nanoparticle characteristics show consistent performance over expected range of viscosities. c. Magnetic particle spectroscopy performance, A5/A3, as a function of mannitol weight % of three different batches of MNPs with increasing average core diameters. d. Simulations of A5/A3 of equivalent nanoparticle characteristics for different average interparticle separations. Reproduced with permission from [117].

