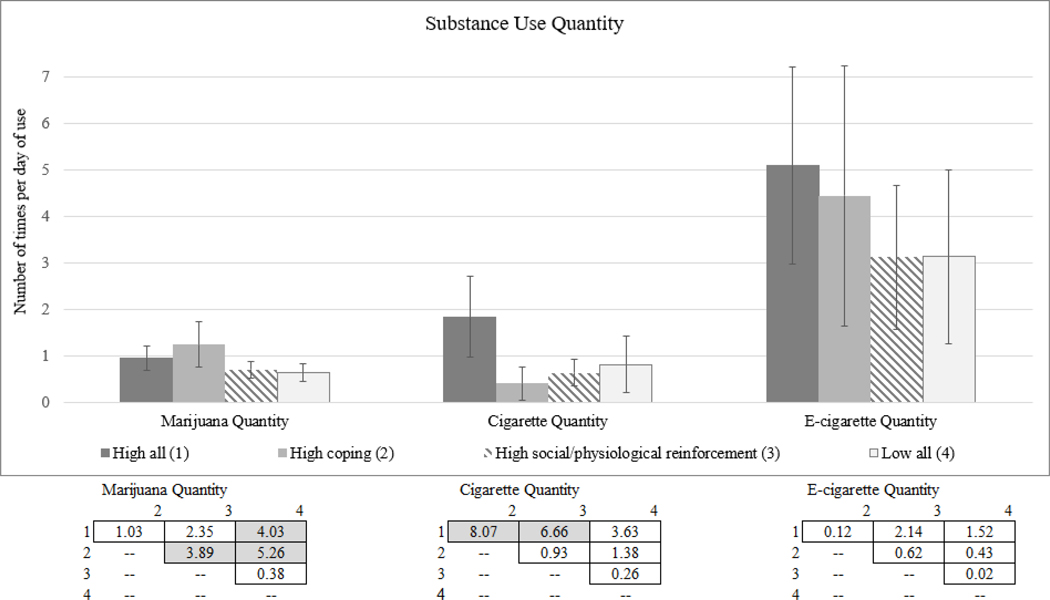
Figure 3. Means, Confidence Intervals, and Chi-Square Values by Time 1 Class for Substance Use Quantity at Time 2.
Note. Figure vertical bars represent mean values on the past year quantity measure for each substance and by the indicated groups. Values in boxes indicate chi-square values between indicated groups. Shaded values are significant at p < .05.

