
Figure 1 |. Single-nucleus RNA-seq reveals age-dependent microglial pathology and neuronal vulnerability in the thalamus of Grn−/− mice.
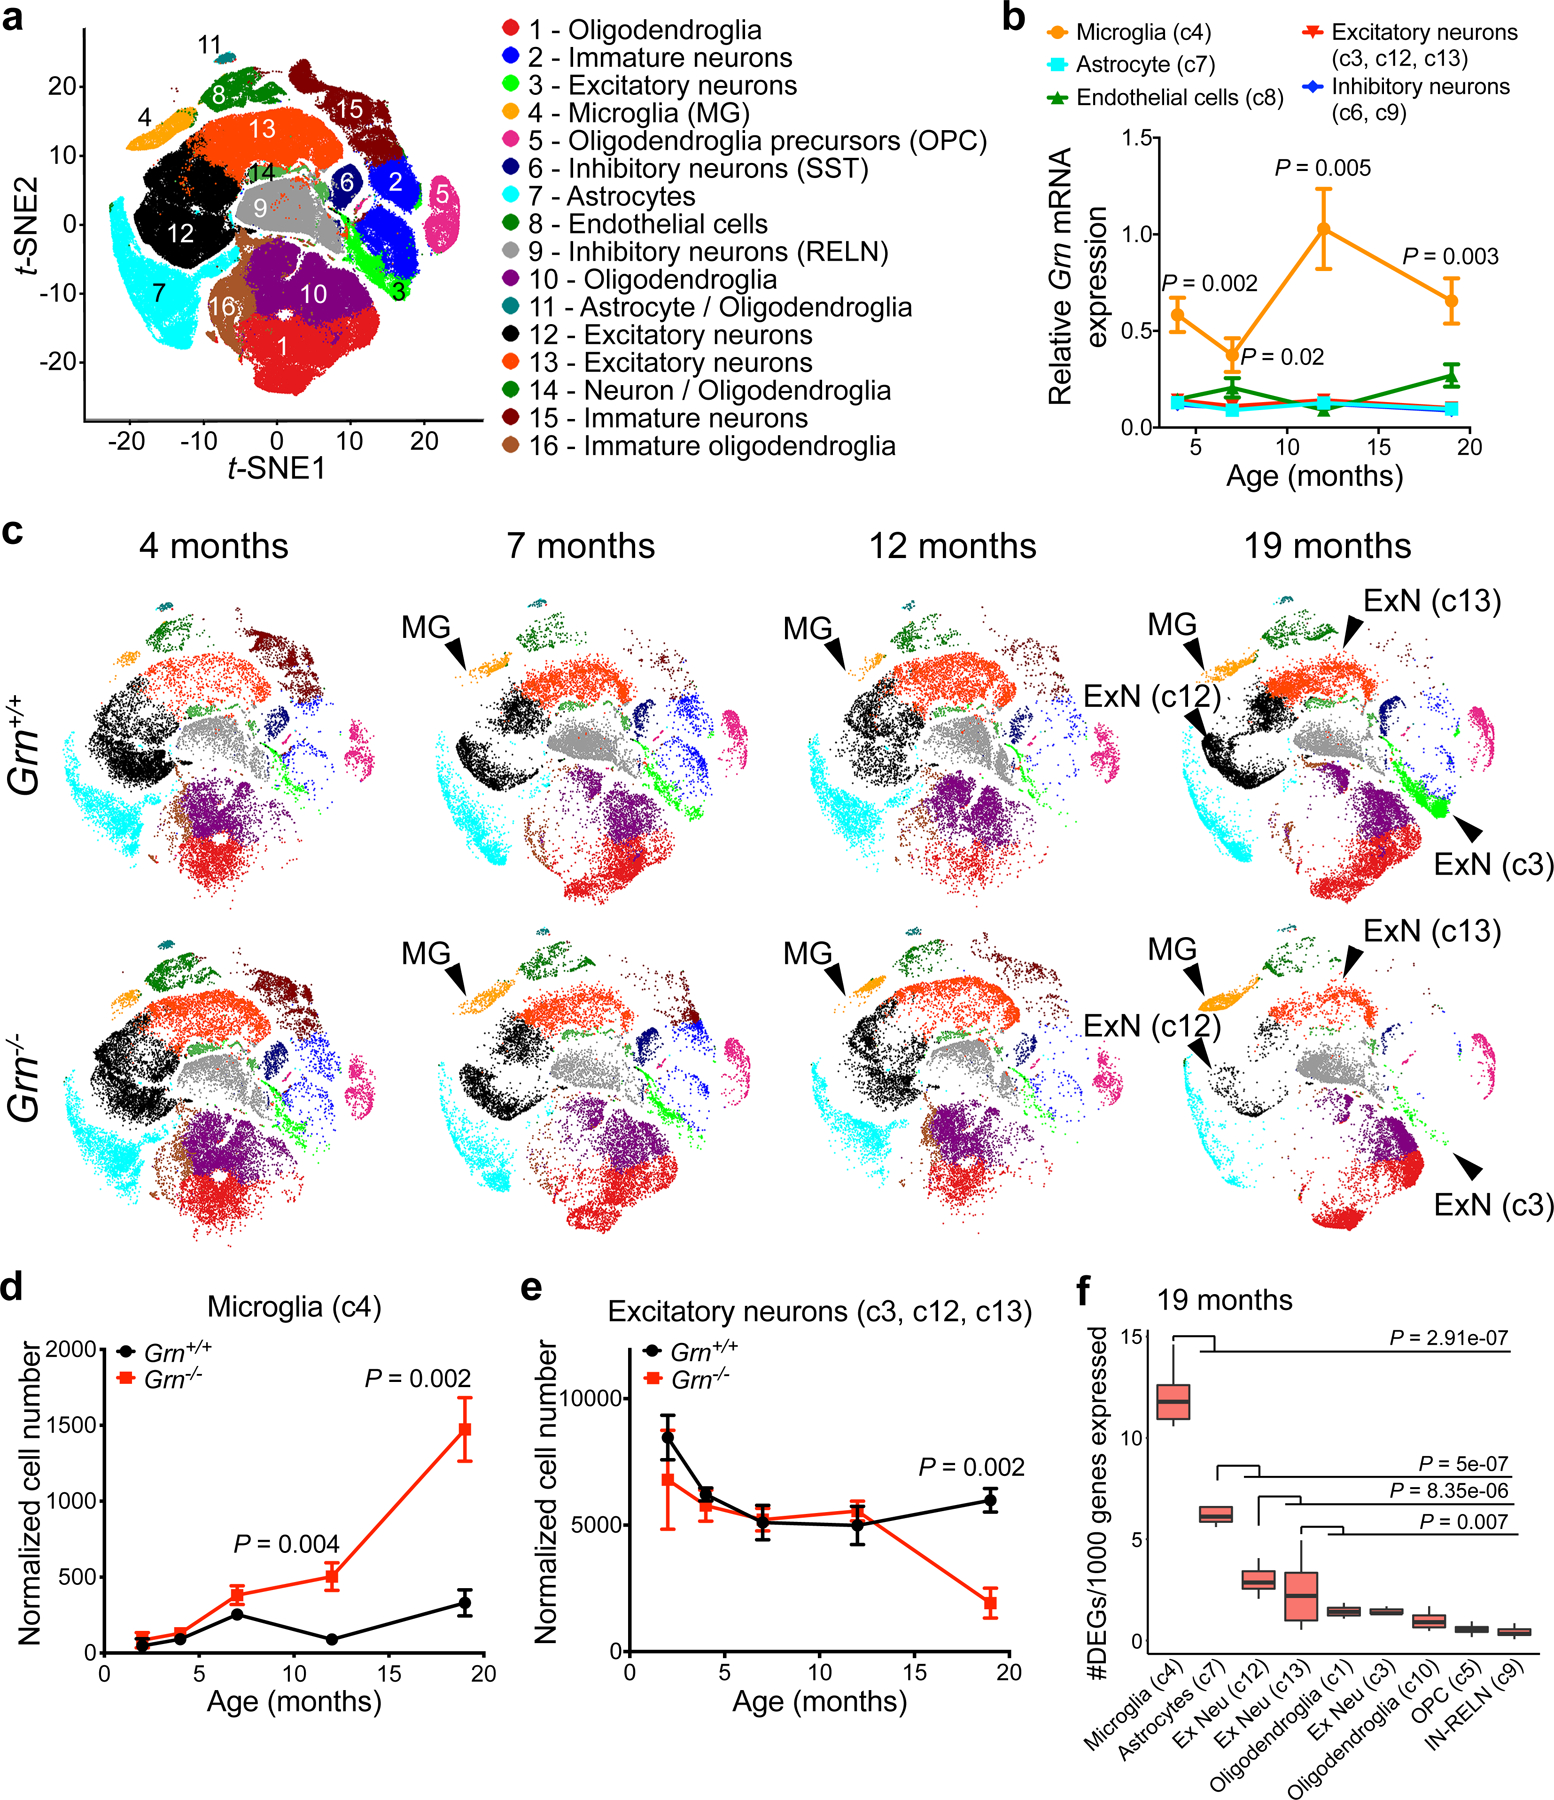
a. Unbiased clustering of single-nucleus RNA-seq (snRNA-seq) data from Grn+/+ and Grn−/− thalamus at 2, 4, 7, 12 and 19 months reveals 16 distinct cell clusters. b. Age-dependent increases of Grn mRNA expression in microglia in Grn+/+ thalamus, whereas Grn mRNA levels remain low in astrocytes, excitatory neurons (c3, c12 and c13), inhibitory neurons and endothelial cells. Data represent mean ± s.e.m.. n= 4 mice per genotype per age. Statistics use two-way ANOVA, with multiple comparisons between microglia and excitatory neurons. c. t-SNE plots show that the 16 cell clusters in Grn+/+ thalamus remain unchanged from 4 to 19 months (top row). In contrast, the microglia cluster (c4) in Grn−/− thalamus shows changes in cell density and distribution in t-SNE plots from 7, 12 to 19 months, whereas the excitatory neuron clusters, including c3, c12 and c13, show significant reduction in cell density at 19 months. d–e. Normalized cell counts for microglia (c4) and excitatory neuron clusters (c3, c12 and c13) in Grn+/+ and Grn−/− thalamus. Data represent mean ± s.e.m.. n= 4 mice per genotype per age. Statistics use two-tailed unpaired Student’s t test. f. Gene burden analysis for glia and neuronal clusters in Grn−/− thalamus compared to Grn+/+ thalamus at 19 months. Box plots show the median and 25–75th percentiles and the whiskers represent the maximum and minimum. Statistics use Mann-Whitney U test.