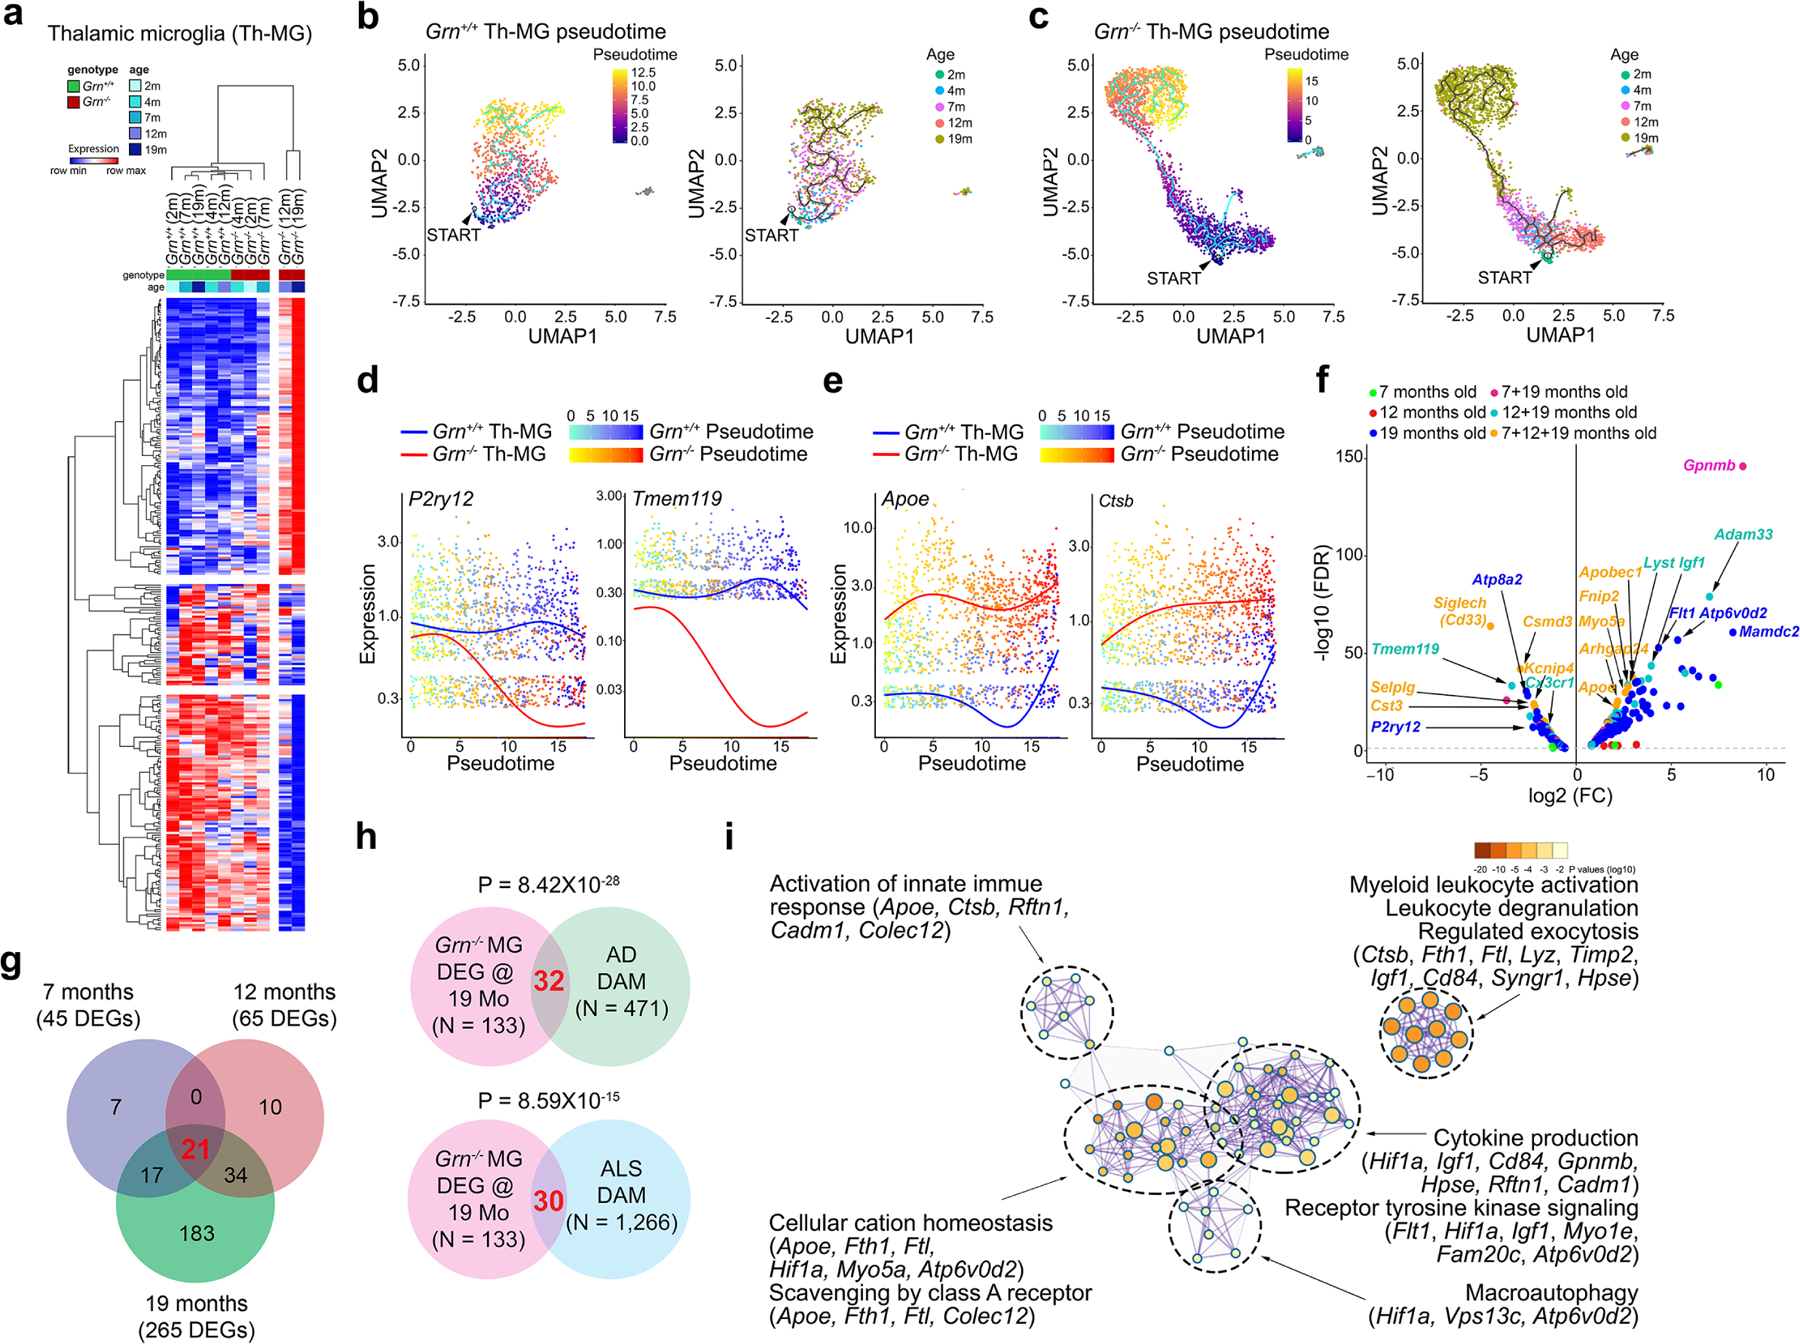
Extended Data Figure 2 |. Age-dependent changes in the transcriptomes and subclustering of microglia in Grn+/+ and Grn−/− thalamus.

a. Heatmap of differentially expressed genes in Grn−/− thalamic microglia show progressive transcriptomic changes from 7, 12 to 19 months. b–c. Pseudotime analyses of snRNA-seq data reveal modest transition of trajectory and subclusters in Grn+/+ thalamic microglia from 2 to 19 months. In contrast, Grn−/− microglia exhibit drastic changes in trajectory and subcluster distribution, especially at 12 and 19 months. The small clusters toward the right of UMAP graphs in Grn+/+ and Grn−/− Th-MG most likely represent a small number of microglia-related cells, such as macrophages, or other unidentified cell types. The presence of this very small cluster does not contribute to the pseudotime results for Grn+/+ or Grn−/− Th-MG. d–e. Combined pseudotime analyses show age-dependent downregulation of homeostasis genes, P2ry12 and Tmem119, and upregulation of genes associated with microglial activation, including Apoe and Ctsb, in Grn−/− microglia. f. Volcano plot showing persistent up- or downregulated genes in Grn−/− microglia from 7 to 19 months. Most differentially expressed genes (DEGs) in Grn−/− microglia are detected at 7 and 19 months (dark red), 12 and 19 months (light blue), or 7, 12 and 19 months (beige), whereas a smaller number of DEGs are detected only in 7 months (green), 12 months (red) or 19 months (dark blue). Statistics for DEGs in volcano plot use MAST. See METHODS for details of the “Meta Cell” pseudobulk approach to generate the volcano plot. g. Venn diagram showing a progressive increase in differentially expressed genes in Grn−/− Th-MG from 7, 12 to 19 months. h. Venn diagrams showing limited overlap of differentially expressed genes in 19 months Grn−/− Th-MG and AD DAM genes, and 19 months Grn−/− Th-MG and ALS DAM genes. Statistics use hypergeometric test. i. Metascape interacting map of GO terms of the 32 genes shared by 19 months Grn−/− Th-MG and AD DAM.
