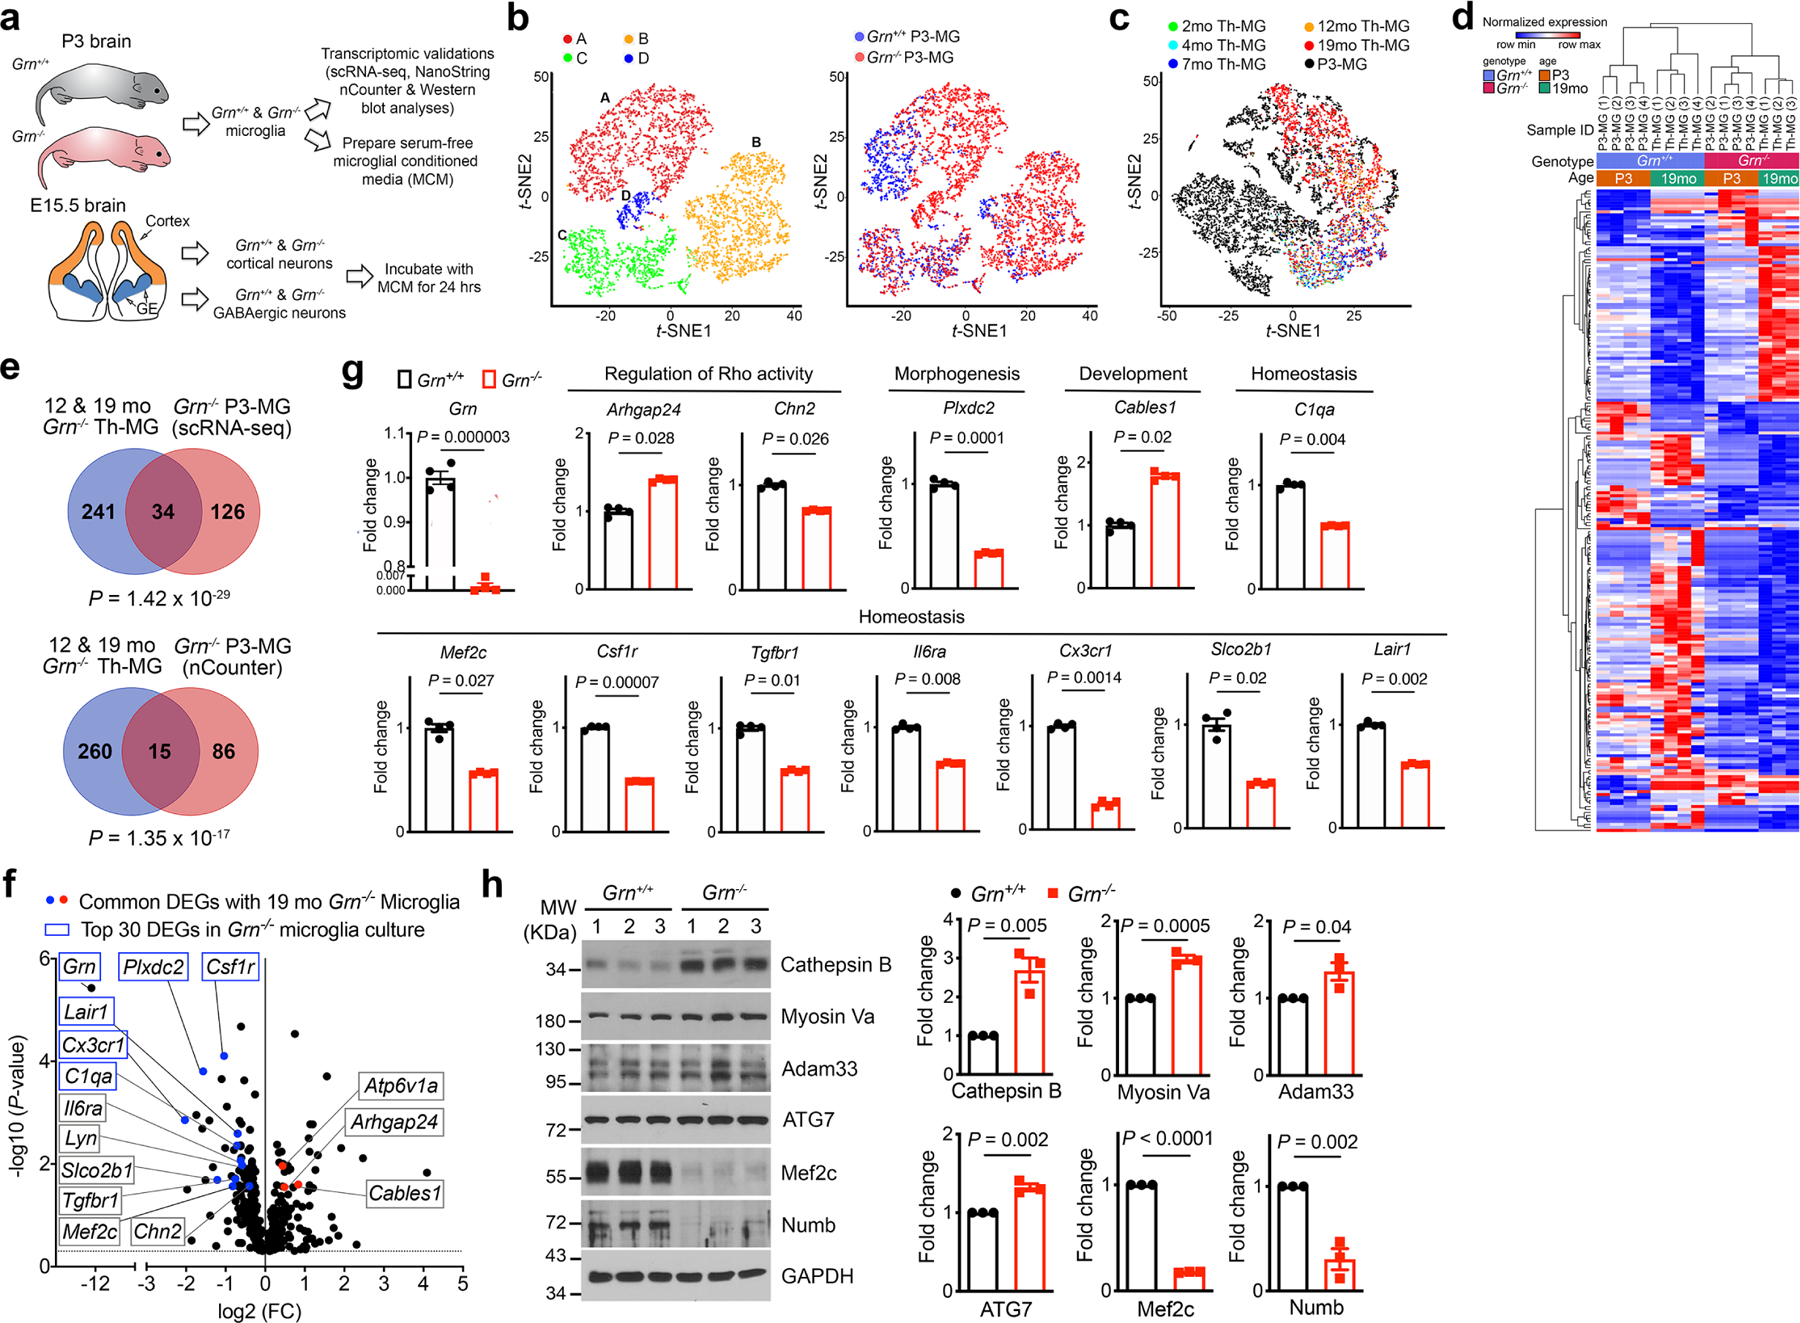
Extended Data Figure 5 |. Characterization of P3 primary microglia from Grn+/+ and Grn−/− mice using single cell RNA-seq, NanoString nCounter neuroinflammation panel, and western blots.

a. A schematic diagram illustrating the study design to characterize primary microglia from postnatal day 3 (P3) Grn+/+ and Grn−/− mice using scRNA-seq and NanoString nCounter neuroinflammation panel, and to prepare serum-free conditioned media from Grn+/+ and Grn−/− P3-MG. In parallel, primary cortical neurons and GABAergic inhibitory neurons are isolated from the developing cortex and ganglionic eminences of embryonic day 15.5 (E15.5) Grn+/+ and Grn−/− mice. After 14 days in vitro (DIV), Grn+/+ and Grn−/− microglial conditioned media (MCM) are added to Grn+/+ and Grn−/− excitatory neurons or GABAergic inhibitory neurons and incubate for 24 hours. b. t-SNE plots of scRNA-seq data from Grn+/+ and Grn−/− P3-MG revealed 4 distinct clusters and the extent of overlapping in cell density and cluster distribution between Grn+/+ and Grn−/− P3-MG. c. Comparison of clusters A of P3-MG with 2 to 19 months (mo) thalamic microglia (Th-MG) reveals more overlapping between P3-MG (black) and 19mo Th-MG (red). d. Hierarchical clustering of gene expression in Grn+/+ and Grn−/− P3-MG cluster A and 19 months old Th-MG. e. Venn diagrams showing the extent of overlapping between DEGs from 12 and 19 months old Th-MG and DEGs in P3-MG identified by scRNA-seq (upper panel) or DEGs in P3-MG identified by NanoString nCounter Neuroinflammation panel (lower panel). Statistics use the hypergeometric test. f. Volcano plot showing the up- and down-regulated genes in Grn−/− P3-MG revealed by nCounter neuroinflammation panel. Statistics use nSolver software version 4.0, provided by the NanoString Technologies, Inc. g. Quantification of the DEGs in Grn−/− P3-MG that are shared with 19 months Grn−/− Th-MG, including upregulation of Arhgap24 and Cables1, and downregulation of Chn2, Plxdc2, C1qa, Mef2c, Csf1r, Cx3cr1, Tgfbr1, Il6ra, Lair1, and Slco2b1. Data represent mean ± s.e.m., n = 4 for each genotype. Statistics uses two-tailed unpaired Student’s t test. h. Western blots and quantification show upregulation of Cathepsin B, Myosin Va, Adam33 and ATG7, but downregulation of Mef2c and Numb. Data represent mean ± s.e.m., n = 3 for each protein. Statistics uses two-tailed unpaired Student’s t test.
