
Extended Data Figure 8: In vitro binding of purified MEK, KSR:MEK, and RAF:MEK to trametinib.
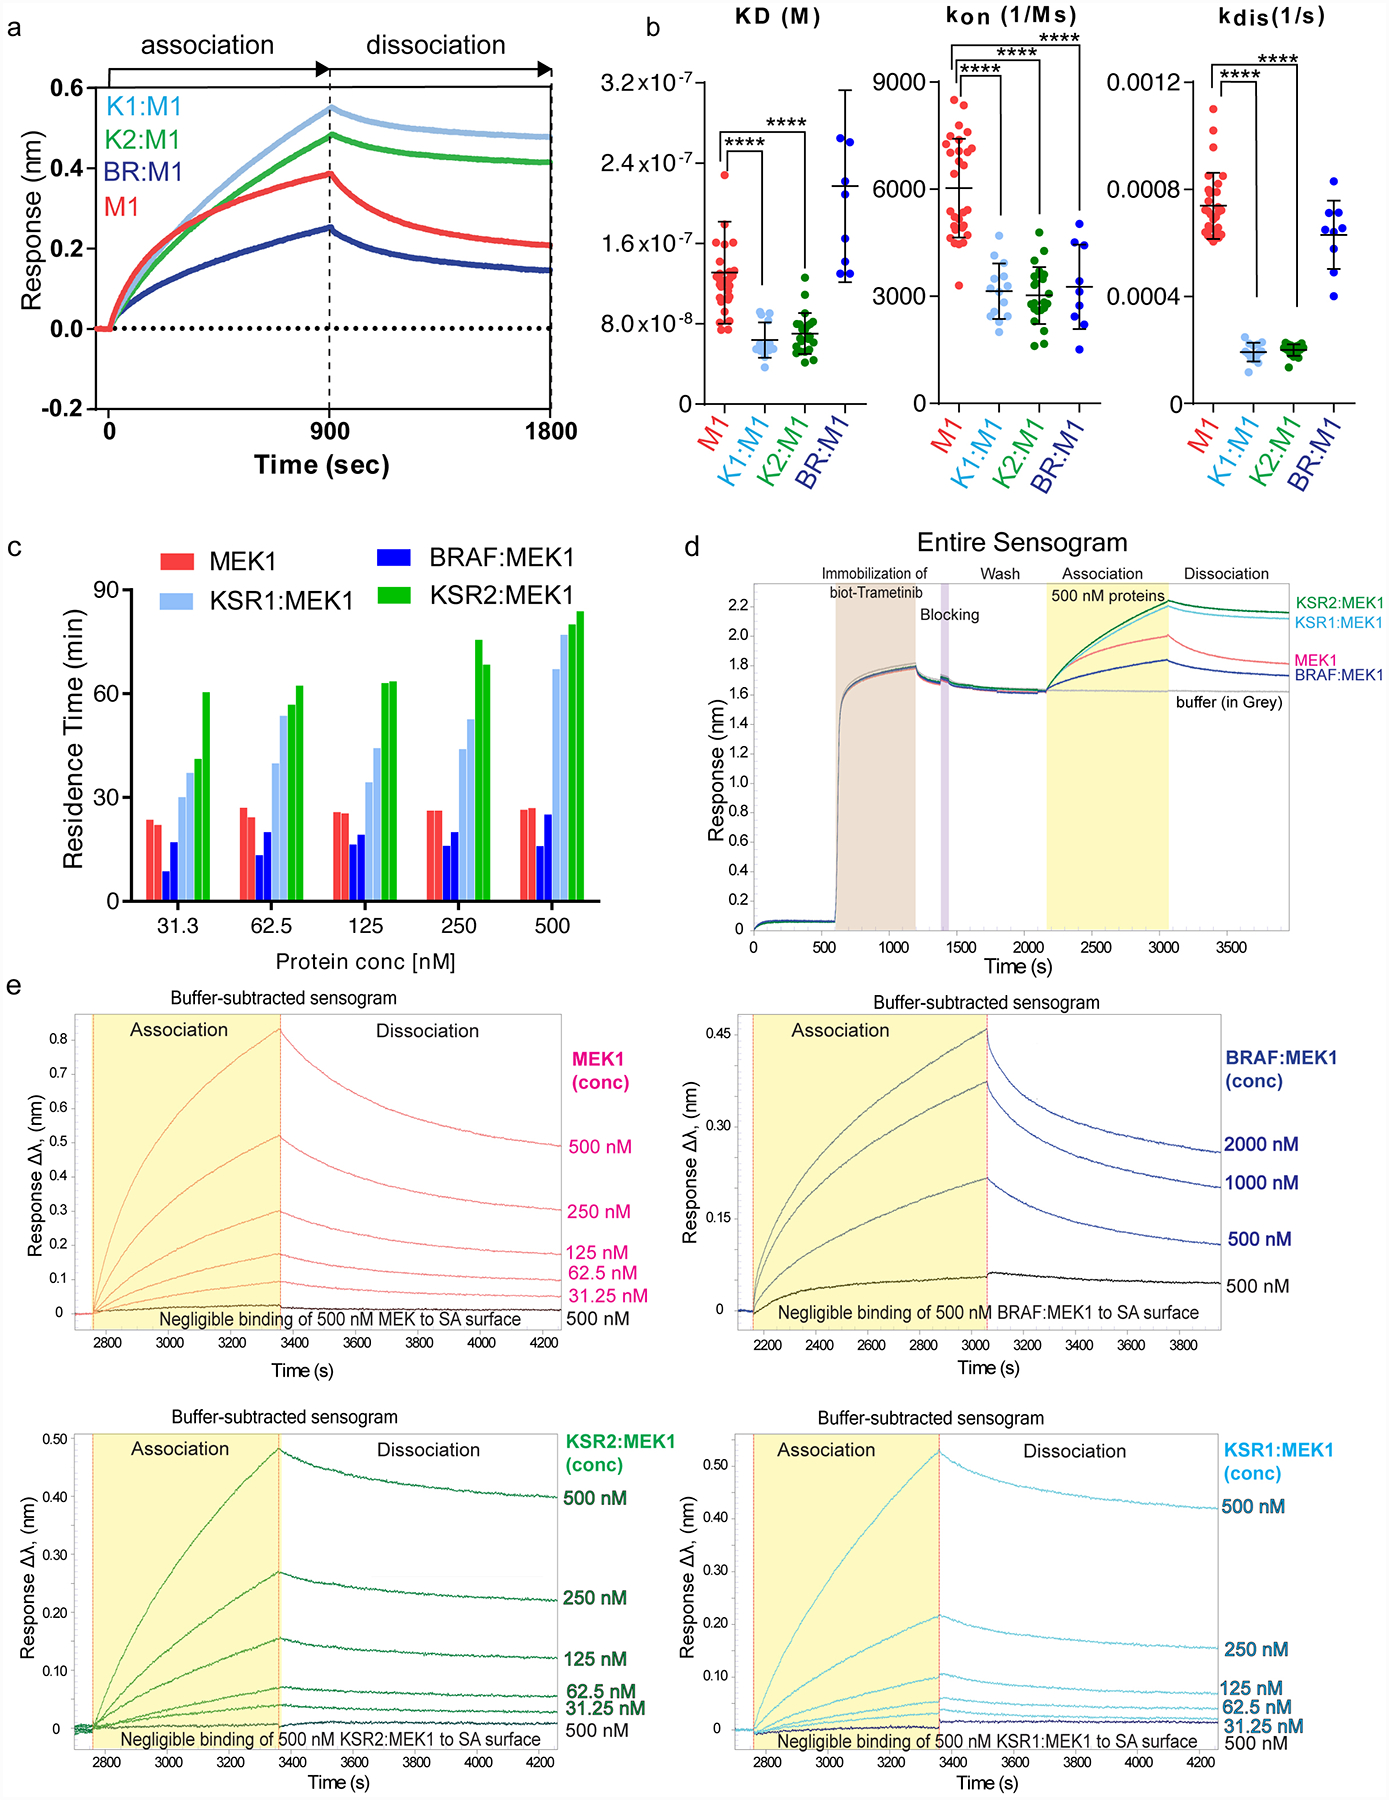
A. Representative binding sensograms for 500 nM each of isolated MEK1 or the indicated KSR:MEK and BRAF:MEK complexes on a biosensor immobilized with biotin-conjugated trametinib. Fitting of association and dissociation phases based on one-to-one binding is provided in Source Data Extended Data Fig. 8.
B. KD (M), kon (1/Ms), and kdis (1/s) values for MEK1 (M), KSR1:MEK1 (K1M1), KSR2:MEK1 (K2M2), BRAF:MEK1 (BRM1) on biotin-linked trametinib. Individual data points from independent binding experiments (n=29, 14, 22, and 9 for MEK1, KSR1:MEK1, KSR2:MEK1, and BRAF:MEK1, respectively) were used for statistical comparisons (**** for p ≤ 0.0001, respectively; Source Data Extended Data Fig. 8). Note, trametinib likely favours dissociation of BRAF from MEK1 for binding. For example, whereas the association and KD data between BRAF:MEK1 and isolated MEK1 markedly differ, the off rate and residence time calculations are similar. This data would be consistent with a model in which the equilibrium of BRAF:MEK1 shifts so as to populate the dissociated state under the conditions of the BLI assays.
C. Residence time values plotted as a function of protein concentration. MEK1 and BRAF:MEK1 display small variations in residence time over the concentrations tested. Whereas KSR2:MEK1 and KSR1:MEK1 demonstrate concentration-dependent changes in residence time. In particular, at low concentrations of KSR-MEK, where the complexes would be expected to more readily dissociate, the kinetic values of purified KSR1:MEK1 and KSR2:MEK1 approached isolated MEK1 and BRAF:MEK1.
D. Full binding curve experiment including loading of biotin-conjugated trametinib for 10 mins, followed by a wash step, and subsequently treating a low-density streptavidin (SA) sensor with a blocking agent, biocytin for 3 min. The sensors were washed extensively to acquire a zero baseline prior to binding analysis. Following, sensors were dipped in wells containing 500 nM of each protein for 15 min, followed by a dissociation in running buffer for 15 min.
E. A biotin conjugated version of trametinib was immobilized on sensor-heads and binding to MEK1, KSR1:MEK1, KSR2:MEK1 or BRAF:MEK1 was monitored using bio-layer interferometry. Increasing concentrations in 2-fold increments of proteins from 31.25 nM to 500 nM for MEK1, KSR1:MEK1, and KSR2:MEK1 and 500 nM to 2000 nM for BRAF:MEK1 were tested. A blank sensor head without immobilized trametinib was used as a control for non-specific binding. KD (M), kon (1/Ms), and kdis (1/s) values were derived from fitting each binding curve.