
Figure 2: Binding of KSR to MEK creates an enlarged allosteric binding pocket for inhibitors.
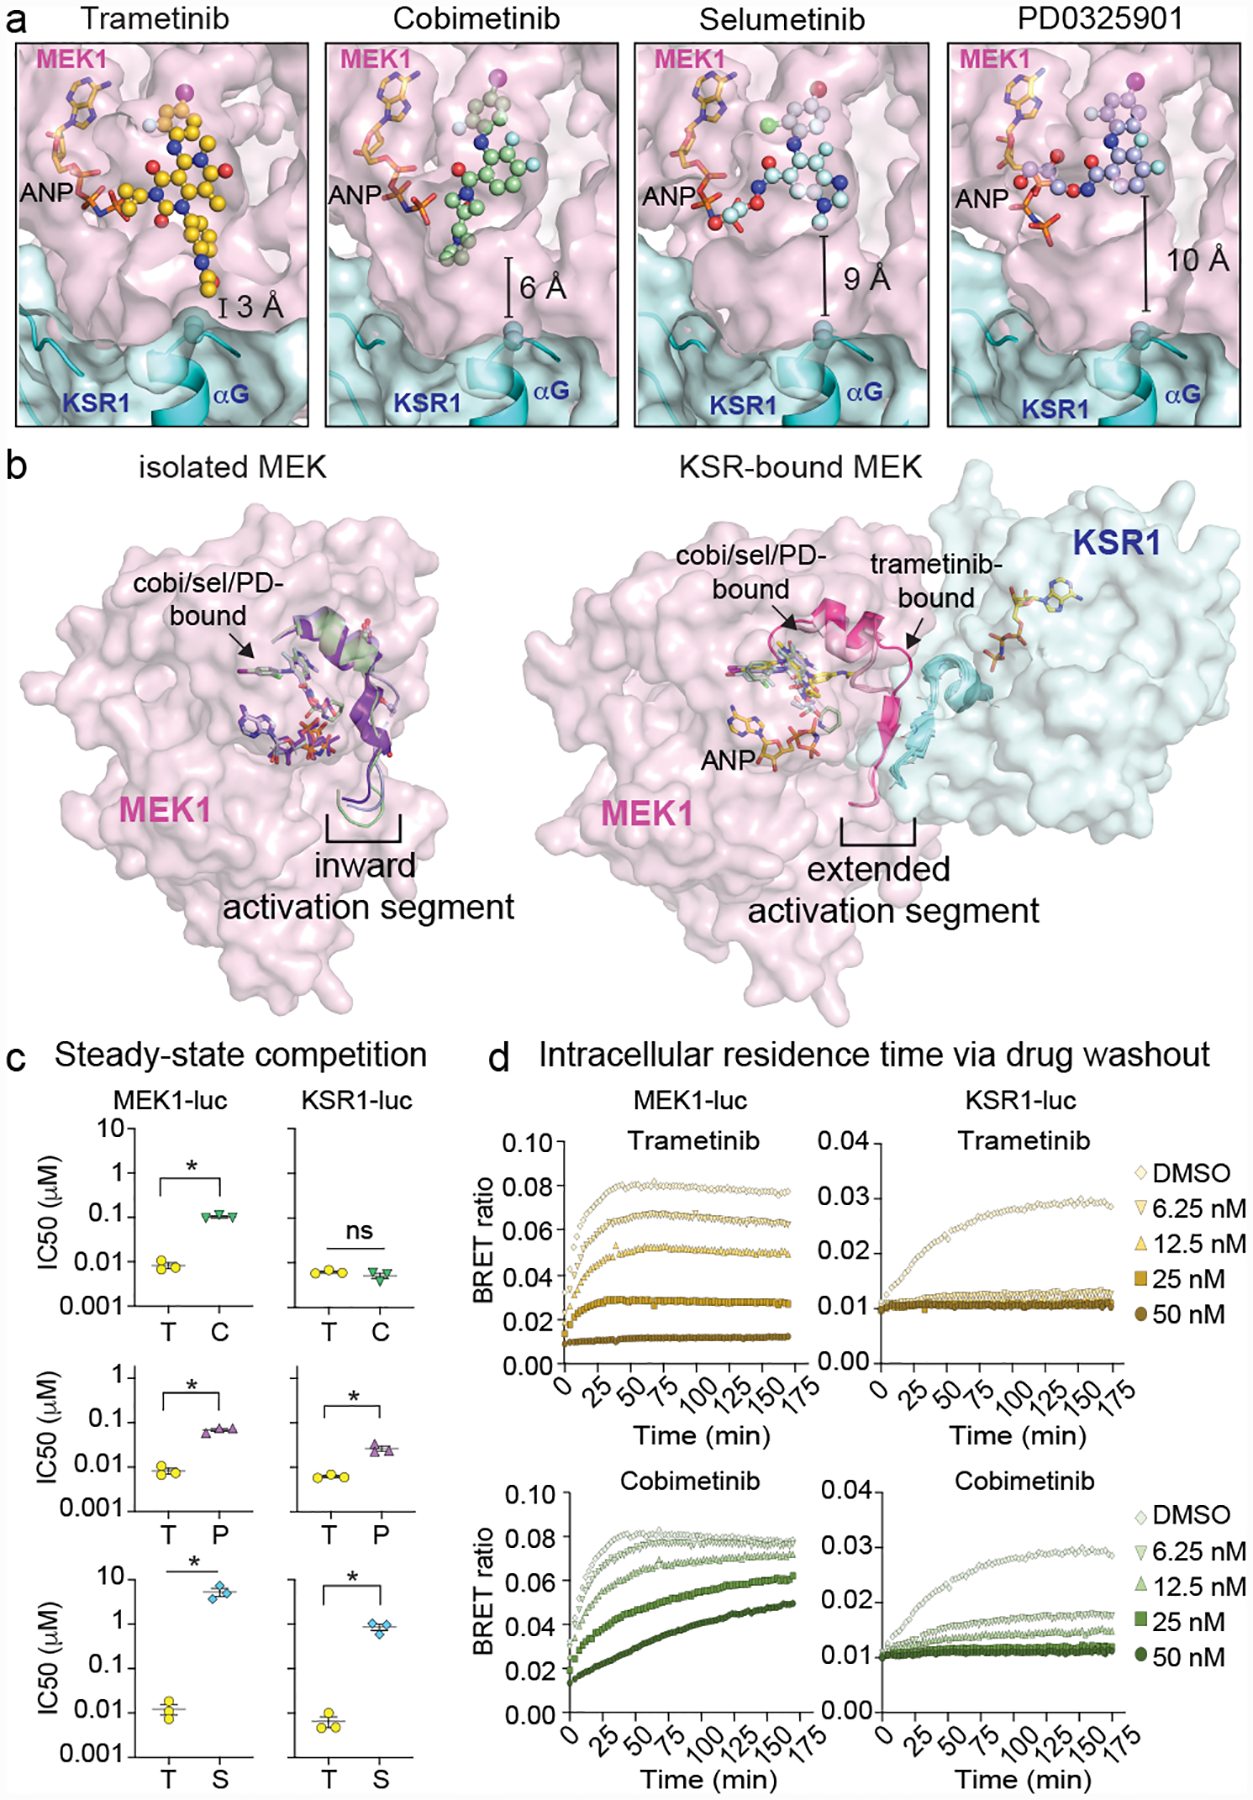
A. Binding comparison of MEKi in KSR1:MEK1. Of the analysed MEKi, only trametinib directly engages KSR1.
B. Structures of isolated MEK1 bound to cobimetinib (PDB ID 4LMN; activation segment colored green), selumetinib (4U7Z; blue) and PD0325901 (3VVH; purple) compared to the KSR1:MEK1 complex for the indicated MEKi. Binding of KSR1 to MEK1 stabilizes an outward orientation of the MEK1 activation segment. See Extended Data Figure 2 for additional analysis and electron density maps.
C. Comparison of trametinib IC50 values vs other MEKi on MEK1-luc and KSR1-luc. Mean and standard errors determined from 3 independent experiments. Each drug was compared to trametinib using an unpaired two-tailed t test where an asterisk represents a P-value less than 0.05. MEK-luc: T(trametinib) vs. C(cobimetinib) p<0.0001, t=16.85, df=4; T vs P(PD0325901) P=0.0004, t=11.26, df=4; T vs S(selumetinib) P=0.0081, t=4.985, df=4; KSR-luc: T vs C P=0.223, t=1.425, df=4; T vs P P=0.0046, t=5.735, df=4, T vs S P=0.0036, df=4.
D. Representative intracellular residence time plots for cells pre-treated with a range of sub-saturating levels of trametinib and cobimetinib that were transfected with MEK1-luc (left) and mouse KSR1-luc (right). The build-up signal (height and rate) is proportional to the dissociation of the indicated compounds on MEK1 or KSR1-bound MEK complex following the addition of Tram-bo (1 μM) on cells that were pre-treated and then washed of the MEKi. Note the DMSO curves are the same in both the trametinib and cobimetinib plots due to the experimental design where all data was collected at once on one plate. See replicate data in Supplementary Figure 2.