
Extended Data Figure 3: Structural differences between human KSR1 and KSR2.
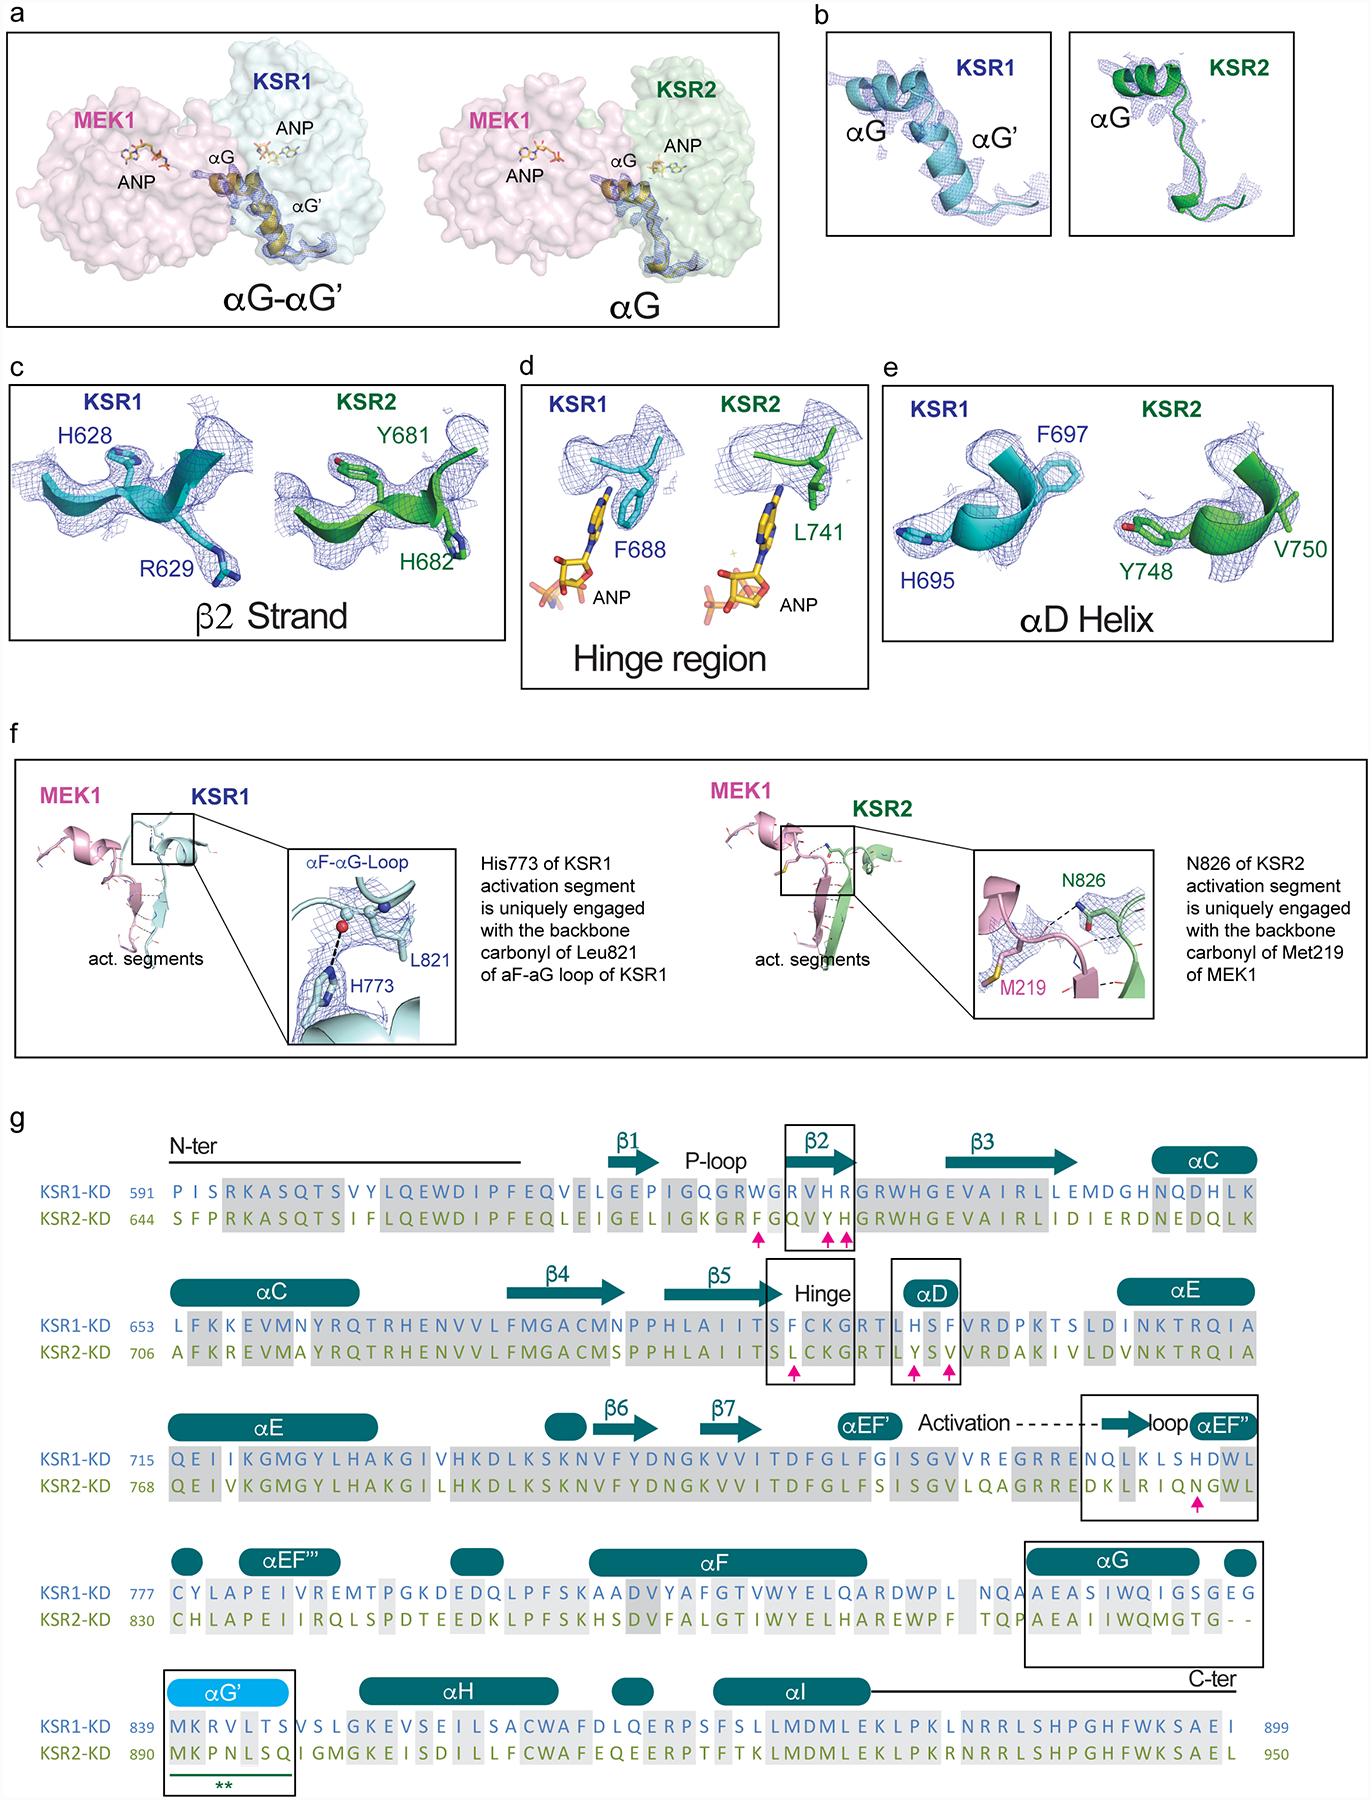
A. Comparison of helices αG-αG’ in the KSR1:MEK1 complex (left) and helix αG in KSR2:MEK1 complex.
B. 2Fo-Fc omit electron density maps contoured at 1.0 σ, with a 2.0 Å cutoff, around helices αG-αG’ in KSR1 (left) and αG in KSR2 (right).
C. 2Fo-Fc omit electron density maps contoured at 1.0 σ, with a 2.0 Å cutoff, around strand β2 in KSR1 (left) and KSR2 (right).
D. 2Fo-Fc omit electron density maps contoured at 1.0 σ, with a 2.0 Å cutoff, around the hinge region in KSR1 (left) and KSR2 (right).
E. 2Fo-Fc omit electron density maps contoured at 1.0 σ, with a 2.0 Å cutoff, around helix αD in KSR1 (left) and KSR2 (right).
F. Positionally equivalent residues H773 in KSR1 and N826 in KSR2 form distinct intra- and inter- molecular contacts, respectively. Specifically, H773 in KSR1 forms a hydrogen bond with the backbone carbonyl of L821 in the αF-αG loop of KSR1 (left). Whereas N826 in KSR2 forms a H-bond across the interfacial region of the KSR2:MEK1 complex via the backbone carbonyl of M219 in MEK1.
G. Structure-based sequence alignment of the pseudokinase domains of KSR1 and KSR2 based on structures solved in this study. Boxed regions are highlighted in the upper panels A-F.