
Extended Data Figure 5: MEKi IC50 measurements and residence time are influenced by protein complex stoichiometry.
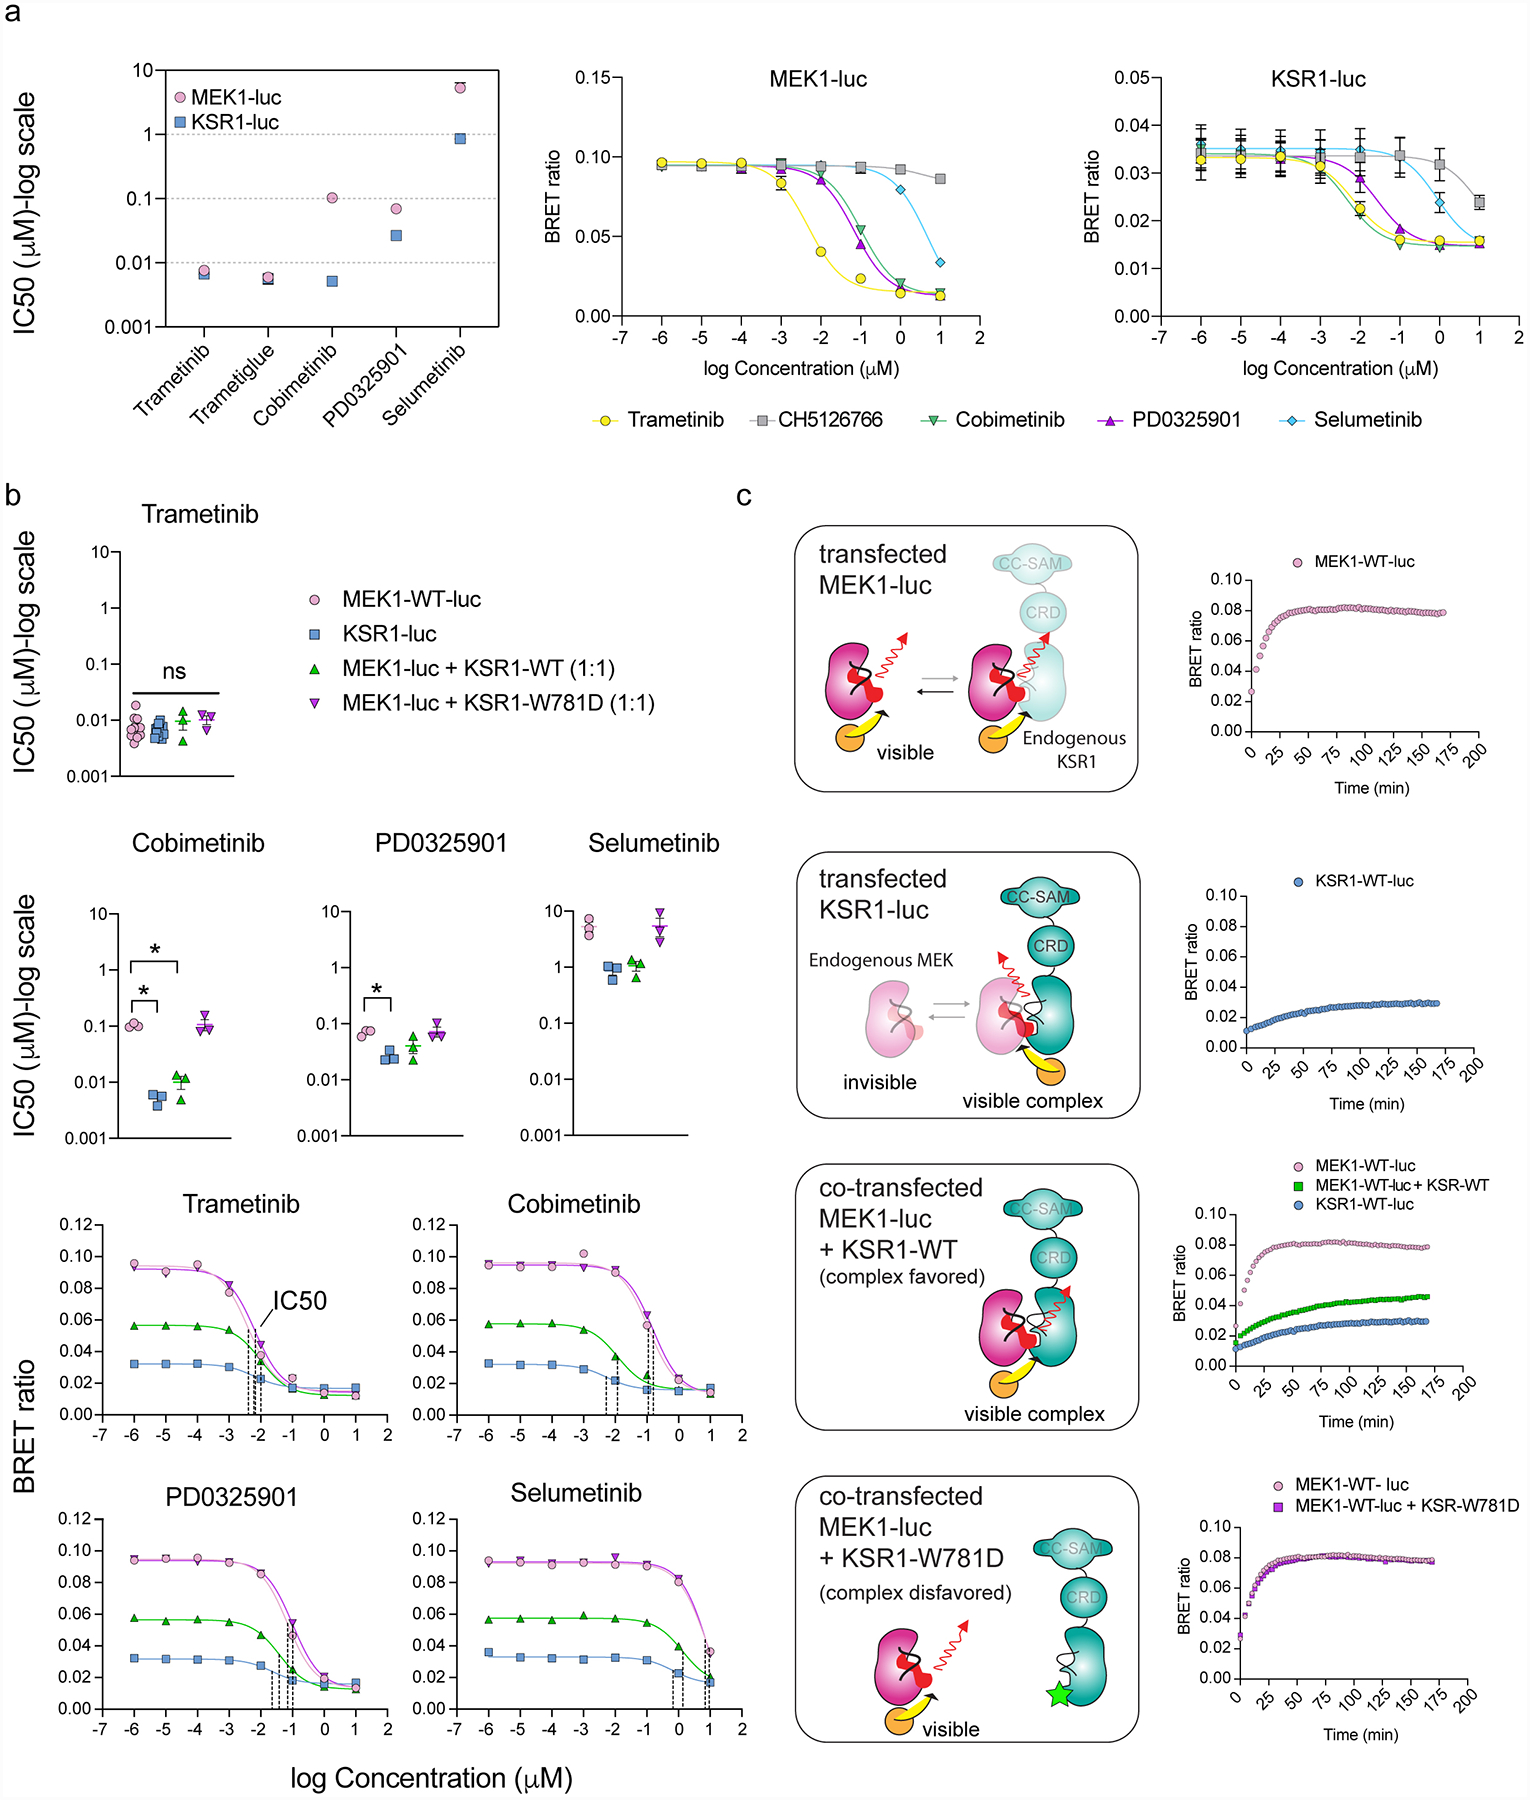
A. IC50 values plotted as a function of MEKi for MEK1-luc and KSR1-luc (left); mean and standard error (SEM) plotted from 3 independent experiments, each conducted in technical triplicate. CH5126766 was not plotted due to poor fit. MEK1-luc (middle) and KSR1-luc (right) dose-response curves for plotted IC50 values using 1 μM Tram-bo; mean and SEM plotted for 3 independent experiments, each conducted in technical triplicates.
B. Comparison of MEKi IC50 measurements and representative dose response curves of MEK1-luc, KSR1-luc, MEK1-luc co-expressed with KSR1-WT, and MEK1-luc co-expressed with KSR1-W781D. Co-expression of KSR1-WT with MEK1-luc gives rise to dose response curves and IC50 values similar to that of KSR1-luc alone. This effect does not occur for the co-expression of MEK1-luc with KSR1-W781D, implying that IC50 differences between MEK1-luc and KSR1-luc depend on the formation of the KSR-MEK complex mediated by helix αG. Mean and standard errors determined from 3 independent experiments, each conducted in technical duplicate. IC50s derived from KSR1-luc, MEK1-luc co-expressed with KSR1-WT or W781D were compared to those of MEK1-luc for each MEKi using an ANOVA where an asterisk represents a P-value less than 0.05. For trametinib, data were subjected to a Kruskal-Wallis test and Dunn’s multiple comparison post-hoc test (MEK1-luc vs KSR1-luc adjusted P>0.9999, MEK1-luc vs MEK1-luc + KSR1-WT adjusted P>0.9999, MEK1-luc vs MEK1-luc + KSR1-W781D adjusted P=0.4298). All other data were subjected to an ordinary one-way ANOVA and Dunnett’s multiple comparison post-hoc test with a single pooled variance (Cobimetinib: MEK1-luc vs KSR1-luc adjusted P=0.0015, MEK1-luc vs MEK1-luc + KSR1-WT P=0.0021, MEK1-luc vs MEK1-luc + KSR1-W781D P=0.9940; PD0325901: MEK1-luc vs KSR1-luc adjusted P=0.0350, MEK1-luc vs MEK1-luc + KSR1-WT P=0.1524, MEK1-luc vs MEK1-luc + KSR1-W781D P=0.9920; Selumetinib: MEK1-luc vs KSR1-luc adjusted P=0.0578, MEK1-luc vs MEK1-luc + KSR1-WT P=0.0693, MEK1-luc vs MEK1-luc + KSR1-W781D P=0.9994. Cobimetinib displayed the largest difference in IC50 value between MEK1-luc and KSR1-luc or MEK1-luc + KSR1-WT.
C. (Left) Schematic for the origin of the BRET signal under co-expression conditions. (Right) Tram-bo build-up curves for MEK1-luc, KSR1-luc, MEK1-luc co-expressed with KSR1-WT, and MEK1-luc co-expressed with KSR1-W781D. Co-expression of MEK1-luc + KSR1-WT resulted in a lower BRET signal and slower tram-bo build-up compared to MEK1-luc alone. Co-expression of MEK1-luc + KSR-W781D gave similar curves to MEK1-luc alone, suggesting that complex formation is disfavored under these conditions.