
Figure 2.
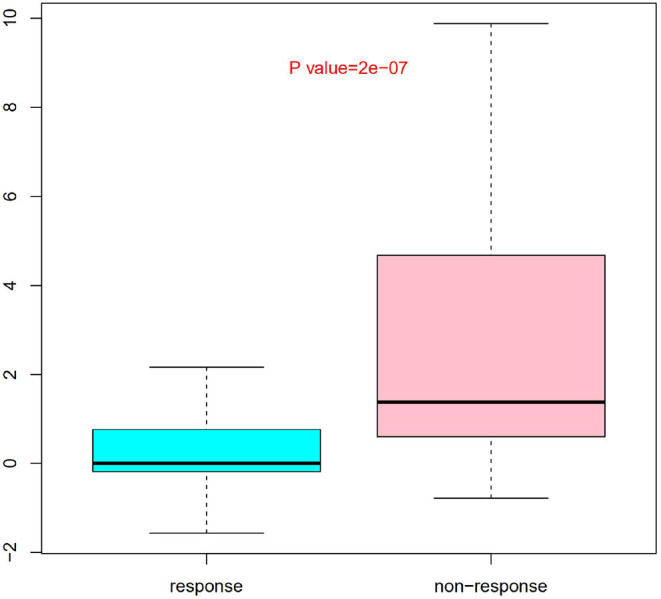
Evaluation difference of weighted genetic risk score (wGRS) of 9 SNPs between IVIG non-responders and responders. Group as x axis and wGRS scores of 9 SNPs with y axis. The difference of wGRS scores between the two groups was significant (Wilcoxon rank-sum test, P = 2.0 × 10⁻⁷).