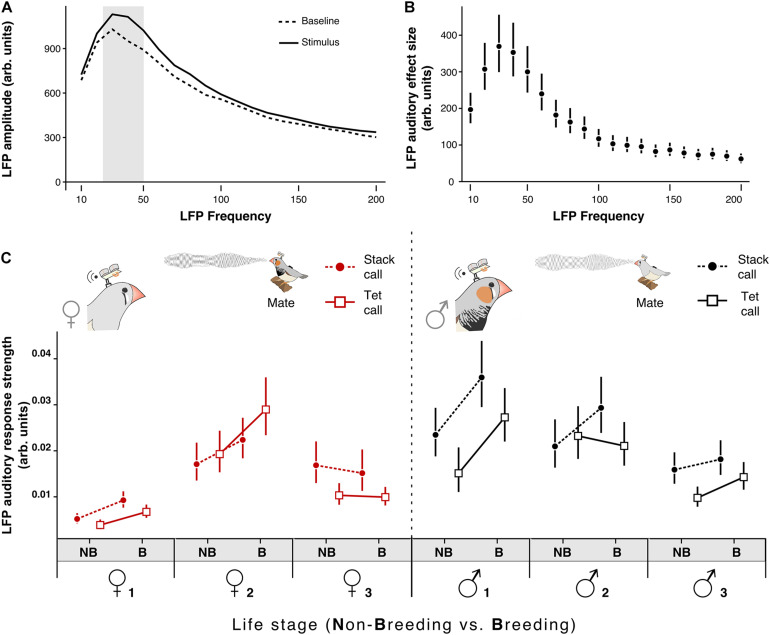
FIGURE 3.
Onset of breeding conditions affects the NCM auditory responses. (A) Average LFP amplitude during Baseline and during the auditory Stimulus from a representative individual; the band of 30–50 Hz is the one with the highest amplitude modulation. (B) Average auditory amplitude modulation (Auditory-Stimulus) from a representative individual (C) Females’ (left) and males’ (right) LFP auditory auditory response strength (for the 30–50 Hz band) in response to the two most frequent contact vocalizations (stack call [circles and dotted line]; tet calls [squares and solid lines]) of their mate in the non-breeding (NB) and breeding (B) life stage. Circles and squares represent the estimated mean from the model and vertical bars the 95% CrI. A probability of difference higher than 95% can be assumed if the estimates of a group do not overlap the CrI of the other group.

