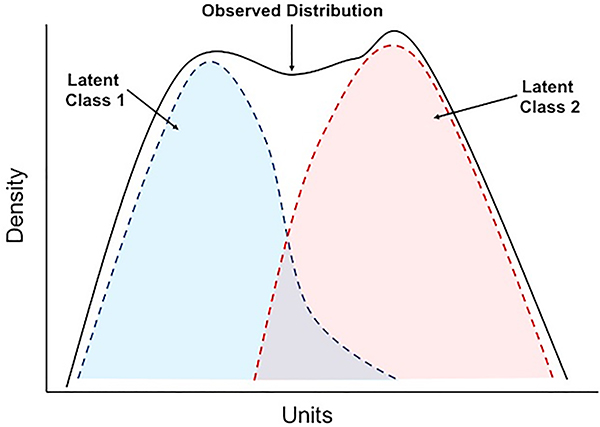
Figure 1.
Illustration of “hidden” or latent classes in a population where the data are normally distributed. The black lines show the density of distribution in the whole population, the dotted lines represent two latent classes (blue and red). The presence of latent classes within a population is a central assumption to the modelling algorithms of latent class analysis.

