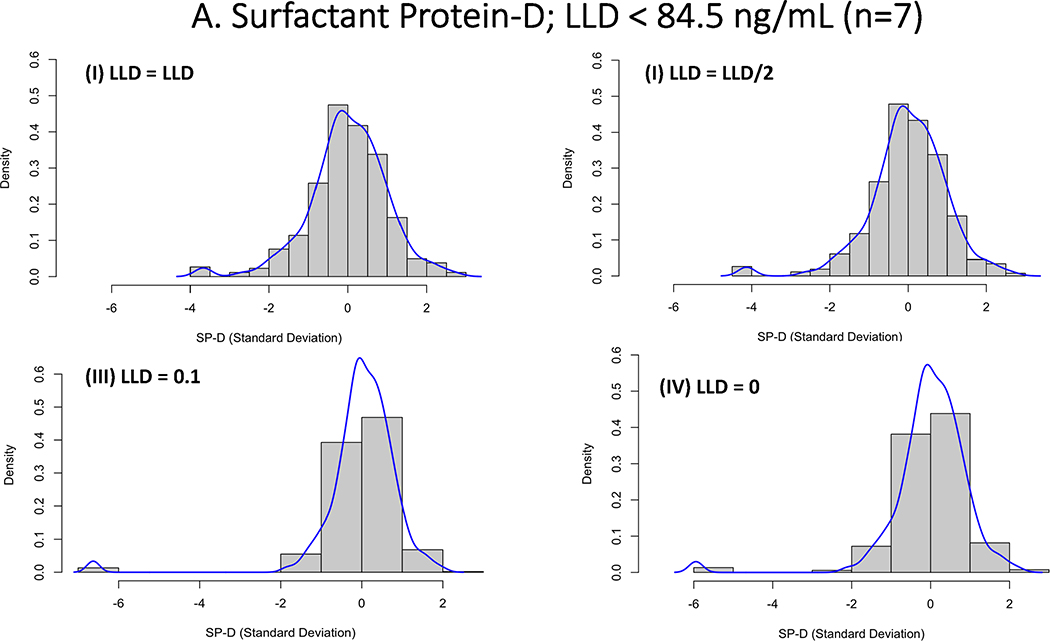
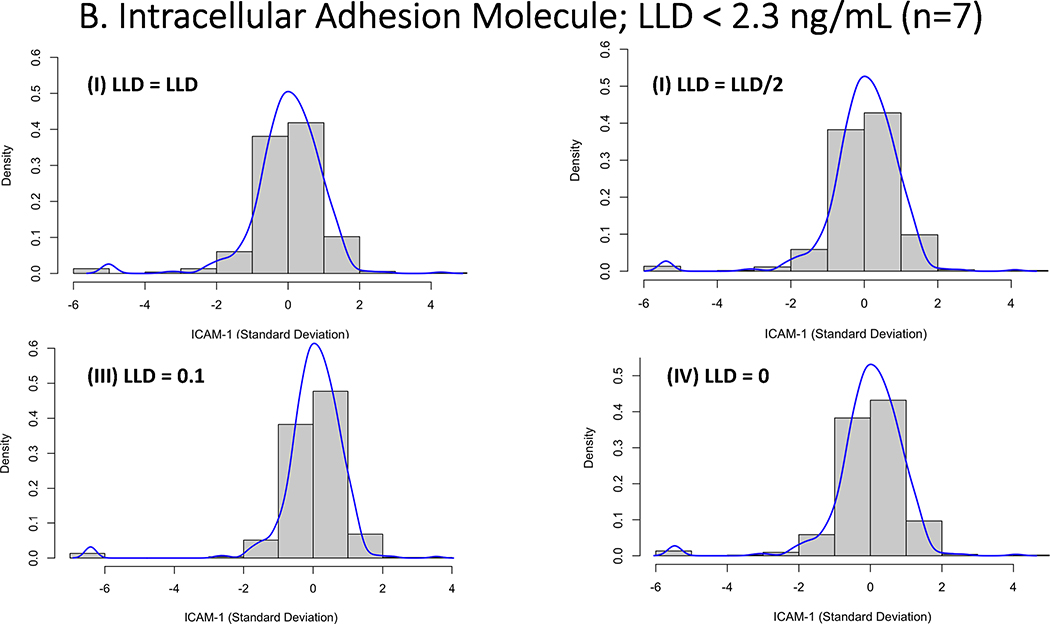
Figure 3.
Histogram demonstrating the impact of imputation strategies for biomarker assay quantification values that were below the lower limit of detection (LLD). For each presented biomarker the values were imputed as either as (I) LLD; (II) LLD/2; (III) LLD = 0 (IV) LLD = 0.1. 3A: Represents z-score transformation and log-transformed data for Surfactant Protein-D, where there were 7 out of 587 values below the LLD (84.5 ng/mL). 3B: Represents z-score transformation and log-transformed data for Intercellular Adhesion Molecule-1, where there were 7 out of 587 values below the LLD (2.3 ng/mL).


