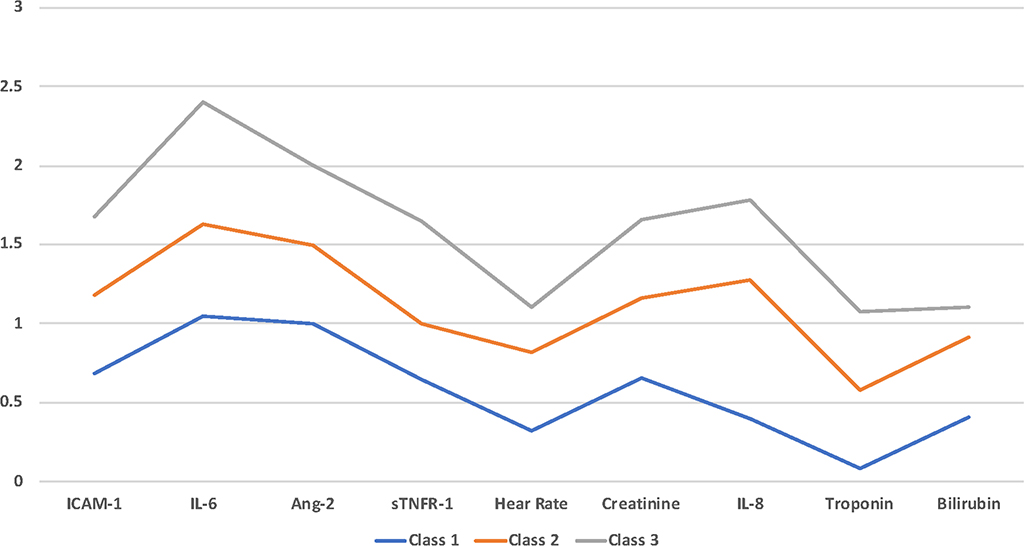
Figure 5: Illustration of the “Salsa effect” in latent class analysis using simulated data. The indicators of the identified classes when plotted on a graph they run parallel to each other, suggesting that the identified classes are merely representative of scales of severity of these variables.
ICAM-1 = Intercellular Adhesion Molecule-1, IL = Interleukin Ang-2 = Angiopoetin-2, sTNFR-1 = Soluble tumor necrosis factor receptor-1.

