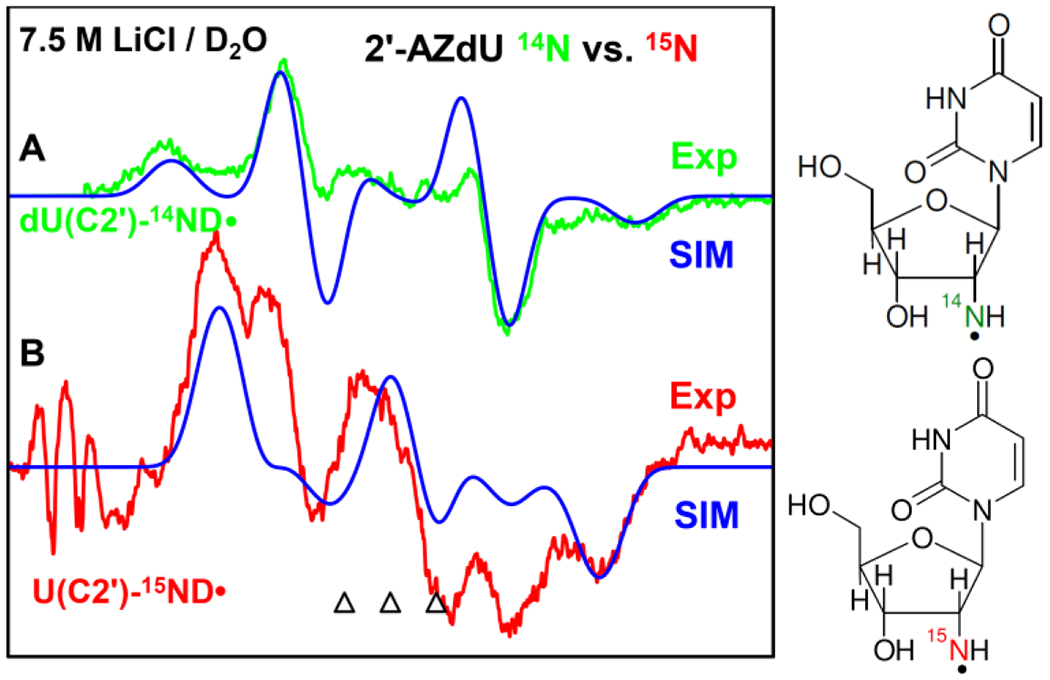
Figure 1.

77 K EPR spectrum of RNH• (U(C2′)-14ND•) formed via electron-induced attachment in aqueous glassy (7.5 M LiCl/D2O) sample of (A) unlabeled 2, green color, and of (B) 15N labeled 2, red color after visible illumination of each sample by using a photoflood lamp at 77 K for 15 minutes to remove the uracil anion radical by photoejection of the excess electron. The simulated spectra (blue) (for simulation parameters, see text) are superimposed on the top of the each experimentally recorded spectrum. The three reference markers (open triangles) in this Figure and in other Figures show the position of Fremy’s salt resonance with the central marker at g = 2.0056. Each of these markers is separated from each other by 13.09 G.
