
Figure 7.
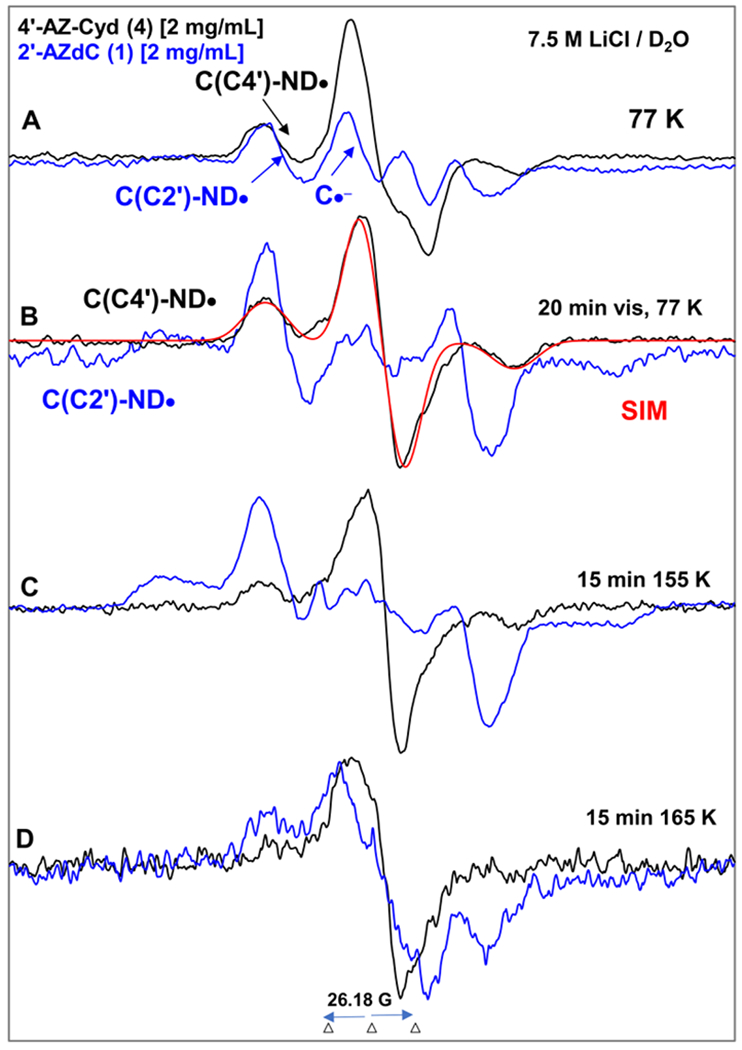
EPR spectra of matched samples of 4′-AZ-C (4, black) and 2′-AZdC (blue,1 also shown in Figure 5) at the native pD (ca. 5) of the homogeneous glassy solution of 7.5 M LiCl in D2O after subtraction of the Cl2•− spectrum7–9,49 from the individual experimentally recorded spectrum. (A) After γ-irradiation (absorbed dose = 500 Gy) produced one-electron addition at 77 K. (B) After visible illumination of samples employing a photoflood lamp at 77 K for 20 minutes. The central doublet in both spectra due to the cytosine anion radical (C•−) is removed by photoejection of the excess electron. The simulated spectrum of C(C4′)-ND• is also shown (for simulation parameters, see text). Spectra (C) and (D) are obtained after subsequent annealing for 15 min in the dark at ca.155 K and at ca. 165 K. All EPR spectra shown in Figures A to D were recorded at 77 K.